Investment fund shares/units (Bond funds balance sheet) - ekonomika ČNB
Aktualizace dat Investment fund shares/units (Bond funds balance sheet) v této aplikaci skončila 30.6.2023. Aktualizovná data časových řad najdete na stránkách nové aplikace z dat ARAD ČNB
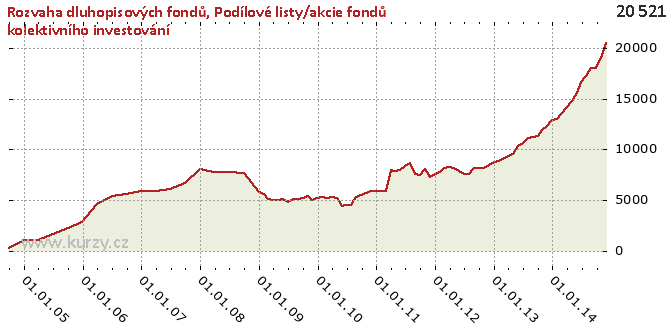
Graf hodnot, Bond funds balance sheet
Meziroční srovnání
Minima a maxima
| Typ | Období | Hodnota |
|---|---|---|
| Max | 30.11.2014 | 20 521.16 |
| Min | 30.09.2004 | 214.83 |
Historické hodnoty
| Období | Hodnota | Předchozí | Rozdíl | Změna | Před rokem | Rozdíl | Změna |
|---|---|---|---|---|---|---|---|
| 30.11.2014 | 20 521.16 | 18 956.70 | 1 564.46 | 8.25% | 12 246.24 | 8 274.92 | 67.57% |
| 31.10.2014 | 18 956.70 | 18 025.43 | 931.27 | 5.17% | 11 907.98 | 7 048.72 | 59.19% |
| 30.09.2014 | 18 025.43 | 18 022.99 | 2.44 | 0.01% | 11 336.59 | 6 688.84 | 59.00% |
| 31.08.2014 | 18 022.99 | 17 229.24 | 793.75 | 4.61% | 11 171.17 | 6 851.81 | 61.33% |
| 31.07.2014 | 17 229.24 | 16 639.97 | 589.27 | 3.54% | 11 079.75 | 6 149.48 | 55.50% |
| 30.06.2014 | 16 639.97 | 15 565.35 | 1 074.62 | 6.90% | 10 649.02 | 5 990.95 | 56.26% |
| 31.05.2014 | 15 565.35 | 14 788.63 | 776.72 | 5.25% | 10 269.81 | 5 295.54 | 51.56% |
| 30.04.2014 | 14 788.63 | 14 179.80 | 608.82 | 4.29% | 9 505.62 | 5 283.00 | 55.58% |
| 31.03.2014 | 14 179.80 | 13 589.60 | 590.21 | 4.34% | 9 335.60 | 4 844.21 | 51.89% |
| 28.02.2014 | 13 589.60 | 13 004.34 | 585.25 | 4.50% | 9 022.80 | 4 566.80 | 50.61% |
| 31.01.2014 | 13 004.34 | 12 889.50 | 114.85 | 0.89% | 8 845.55 | 4 158.80 | 47.02% |
| 31.12.2013 | 12 889.50 | 12 246.24 | 643.26 | 5.25% | 8 788.35 | 4 101.15 | 46.67% |
| 30.11.2013 | 12 246.24 | 11 907.98 | 338.26 | 2.84% | 8 443.10 | 3 803.14 | 45.04% |
| 31.10.2013 | 11 907.98 | 11 336.59 | 571.39 | 5.04% | 8 114.87 | 3 793.11 | 46.74% |
| 30.09.2013 | 11 336.59 | 11 171.17 | 165.42 | 1.48% | 8 154.50 | 3 182.09 | 39.02% |
| 31.08.2013 | 11 171.17 | 11 079.75 | 91.42 | 0.83% | 8 104.18 | 3 067.00 | 37.84% |
| 31.07.2013 | 11 079.75 | 10 649.02 | 430.73 | 4.04% | 7 563.06 | 3 516.69 | 46.50% |
| 30.06.2013 | 10 649.02 | 10 269.81 | 379.21 | 3.69% | 7 558.88 | 3 090.14 | 40.88% |
| 31.05.2013 | 10 269.81 | 9 505.62 | 764.18 | 8.04% | 7 820.67 | 2 449.14 | 31.32% |
| 30.04.2013 | 9 505.62 | 9 335.60 | 170.03 | 1.82% | 8 196.29 | 1 309.34 | 15.97% |
| 31.03.2013 | 9 335.60 | 9 022.80 | 312.80 | 3.47% | 8 277.41 | 1 058.19 | 12.78% |
| 28.02.2013 | 9 022.80 | 8 845.55 | 177.25 | 2.00% | 8 161.51 | 861.29 | 10.55% |
| 31.01.2013 | 8 845.55 | 8 788.35 | 57.20 | 0.65% | 7 772.26 | 1 073.29 | 13.81% |
| 31.12.2012 | 8 788.35 | 8 443.10 | 345.25 | 4.09% | 7 553.07 | 1 235.27 | 16.35% |
| 30.11.2012 | 8 443.10 | 8 114.87 | 328.23 | 4.04% | 7 277.06 | 1 166.04 | 16.02% |
| 31.10.2012 | 8 114.87 | 8 154.50 | -39.63 | -0.49% | 8 071.41 | 43.46 | 0.54% |
| 30.09.2012 | 8 154.50 | 8 104.18 | 50.32 | 0.62% | 7 438.65 | 715.86 | 9.62% |
| 31.08.2012 | 8 104.18 | 7 563.06 | 541.12 | 7.15% | 7 558.71 | 545.47 | 7.22% |
| 31.07.2012 | 7 563.06 | 7 558.88 | 4.18 | 0.06% | 8 681.22 | -1 118.16 | -12.88% |
| 30.06.2012 | 7 558.88 | 7 820.67 | - 261.79 | -3.35% | 8 370.72 | - 811.84 | -9.70% |
| 31.05.2012 | 7 820.67 | 8 196.29 | - 375.62 | -4.58% | 7 953.91 | - 133.24 | -1.68% |
| 30.04.2012 | 8 196.29 | 8 277.41 | -81.12 | -0.98% | 7 807.30 | 388.99 | 4.98% |
| 31.03.2012 | 8 277.41 | 8 161.51 | 115.90 | 1.42% | 7 954.08 | 323.33 | 4.06% |
| 29.02.2012 | 8 161.51 | 7 772.26 | 389.25 | 5.01% | 5 915.70 | 2 245.80 | 37.96% |
| 31.01.2012 | 7 772.26 | 7 553.07 | 219.18 | 2.90% | 5 878.67 | 1 893.58 | 32.21% |
| 31.12.2011 | 7 553.07 | 7 277.06 | 276.01 | 3.79% | 5 921.76 | 1 631.32 | 27.55% |
| 30.11.2011 | 7 277.06 | 8 071.41 | - 794.35 | -9.84% | 5 841.59 | 1 435.48 | 24.57% |
| 31.10.2011 | 8 071.41 | 7 438.65 | 632.76 | 8.51% | 5 673.05 | 2 398.36 | 42.28% |
| 30.09.2011 | 7 438.65 | 7 558.71 | - 120.06 | -1.59% | 5 533.01 | 1 905.63 | 34.44% |
| 31.08.2011 | 7 558.71 | 8 681.22 | -1 122.51 | -12.93% | 5 286.50 | 2 272.20 | 42.98% |
| 31.07.2011 | 8 681.22 | 8 370.72 | 310.50 | 3.71% | 4 535.57 | 4 145.65 | 91.40% |
| 30.06.2011 | 8 370.72 | 7 953.91 | 416.81 | 5.24% | 4 467.78 | 3 902.94 | 87.36% |
| 31.05.2011 | 7 953.91 | 7 807.30 | 146.62 | 1.88% | 4 437.90 | 3 516.01 | 79.23% |
| 30.04.2011 | 7 807.30 | 7 954.08 | - 146.78 | -1.85% | 5 141.62 | 2 665.68 | 51.85% |
| 31.03.2011 | 7 954.08 | 5 915.70 | 2 038.38 | 34.46% | 5 315.61 | 2 638.47 | 49.64% |
| 28.02.2011 | 5 915.70 | 5 878.67 | 37.03 | 0.63% | 5 185.60 | 730.11 | 14.08% |
| 31.01.2011 | 5 878.67 | 5 921.76 | -43.09 | -0.73% | 5 267.23 | 611.45 | 11.61% |
| 31.12.2010 | 5 921.76 | 5 841.59 | 80.17 | 1.37% | 5 171.65 | 750.11 | 14.50% |
| 30.11.2010 | 5 841.59 | 5 673.05 | 168.54 | 2.97% | 5 003.16 | 838.42 | 16.76% |
| 31.10.2010 | 5 673.05 | 5 533.01 | 140.03 | 2.53% | 5 399.02 | 274.03 | 5.08% |
| 30.09.2010 | 5 533.01 | 5 286.50 | 246.51 | 4.66% | 5 166.21 | 366.80 | 7.10% |
| 31.08.2010 | 5 286.50 | 4 535.57 | 750.93 | 16.56% | 5 118.69 | 167.81 | 3.28% |
| 31.07.2010 | 4 535.57 | 4 467.78 | 67.79 | 1.52% | 5 080.13 | - 544.56 | -10.72% |
| 30.06.2010 | 4 467.78 | 4 437.90 | 29.88 | 0.67% | 4 777.64 | - 309.86 | -6.49% |
| 31.05.2010 | 4 437.90 | 5 141.62 | - 703.72 | -13.69% | 5 048.31 | - 610.40 | -12.09% |
| 30.04.2010 | 5 141.62 | 5 315.61 | - 173.99 | -3.27% | 4 959.73 | 181.89 | 3.67% |
| 31.03.2010 | 5 315.61 | 5 185.60 | 130.01 | 2.51% | 4 949.87 | 365.74 | 7.39% |
| 28.02.2010 | 5 185.60 | 5 267.23 | -81.63 | -1.55% | 5 106.36 | 79.24 | 1.55% |
| 31.01.2010 | 5 267.23 | 5 171.65 | 95.58 | 1.85% | 5 610.31 | - 343.08 | -6.12% |
| 31.12.2009 | 5 171.65 | 5 003.16 | 168.48 | 3.37% | 5 790.46 | - 618.82 | -10.69% |
| 30.11.2009 | 5 003.16 | 5 399.02 | - 395.86 | -7.33% | 7 611.64 | -2 608.48 | -34.27% |
| 31.10.2009 | 5 399.02 | 5 166.21 | 232.81 | 4.51% | 7 611.64 | -2 212.62 | -29.07% |
| 30.09.2009 | 5 166.21 | 5 118.69 | 47.52 | 0.93% | 7 611.64 | -2 445.43 | -32.13% |
| 31.08.2009 | 5 118.69 | 5 080.13 | 38.56 | 0.76% | 7 767.75 | -2 649.06 | -34.10% |
| 31.07.2009 | 5 080.13 | 4 777.64 | 302.49 | 6.33% | 7 767.75 | -2 687.62 | -34.60% |
| 30.06.2009 | 4 777.64 | 5 048.31 | - 270.66 | -5.36% | 7 767.75 | -2 990.11 | -38.49% |
| 31.05.2009 | 5 048.31 | 4 959.73 | 88.58 | 1.79% | 7 741.22 | -2 692.91 | -34.79% |
| 30.04.2009 | 4 959.73 | 4 949.87 | 9.86 | 0.20% | 7 741.22 | -2 781.49 | -35.93% |
| 31.03.2009 | 4 949.87 | 5 106.36 | - 156.49 | -3.06% | 7 741.22 | -2 791.35 | -36.06% |
| 28.02.2009 | 5 106.36 | 5 610.31 | - 503.95 | -8.98% | 8 063.07 | -2 956.71 | -36.67% |
| 31.01.2009 | 5 610.31 | 5 790.46 | - 180.16 | -3.11% | 8 063.07 | -2 452.77 | -30.42% |
| 31.12.2008 | 5 790.46 | 7 611.64 | -1 821.18 | -23.93% | 8 063.07 | -2 272.61 | -28.19% |
| 30.09.2008 | 7 611.64 | 7 767.75 | - 156.11 | -2.01% | 6 641.46 | 970.18 | 14.61% |
| 30.06.2008 | 7 767.75 | 7 741.22 | 26.53 | 0.34% | 6 040.25 | 1 727.50 | 28.60% |
| 31.03.2008 | 7 741.22 | 8 063.07 | - 321.85 | -3.99% | 5 839.13 | 1 902.09 | 32.57% |
| 31.12.2007 | 8 063.07 | 6 641.46 | 1 421.61 | 21.41% | 5 881.35 | 2 181.72 | 37.10% |
| 30.09.2007 | 6 641.46 | 6 040.25 | 601.21 | 9.95% | 5 604.68 | 1 036.78 | 18.50% |
| 30.06.2007 | 6 040.25 | 5 839.13 | 201.12 | 3.44% | 5 358.62 | 681.63 | 12.72% |
| 31.03.2007 | 5 839.13 | 5 881.35 | -42.22 | -0.72% | 4 621.46 | 1 217.67 | 26.35% |
| 31.12.2006 | 5 881.35 | 5 604.68 | 276.67 | 4.94% | 2 864.14 | 3 017.21 | 105.34% |
| 30.09.2006 | 5 604.68 | 5 358.62 | 246.06 | 4.59% | 2 188.29 | 3 416.39 | 156.12% |
| 30.06.2006 | 5 358.62 | 4 621.46 | 737.16 | 15.95% | 1 606.47 | 3 752.14 | 233.56% |
| 31.03.2006 | 4 621.46 | 2 864.14 | 1 757.32 | 61.36% | 1 032.60 | 3 588.86 | 347.55% |
| 31.12.2005 | 2 864.14 | 2 188.29 | 675.85 | 30.88% | 1 056.53 | 1 807.62 | 171.09% |
| 30.09.2005 | 2 188.29 | 1 606.47 | 581.82 | 36.22% | 214.83 | 1 973.46 | 918.60% |
| 30.06.2005 | 1 606.47 | 1 032.60 | 573.87 | 55.58% | - | - | - |
| 31.03.2005 | 1 032.60 | 1 056.53 | -23.92 | -2.26% | - | - | - |
| 31.12.2004 | 1 056.53 | 214.83 | 841.69 | 391.79% | - | - | - |
| 30.09.2004 | 214.83 | - | - | - | - | - | - |
Graf jako obrázek

Podobné sestavy
Aplikace Ekonomika ČNB ze sekce makroekonomika zobrazuje časové řady hlavních makroekonomických údajů z ekonomiky ČR. Najdete zde přes 10.000 grafů různých hodnot od úrokových sazeb, přes statistiky státního rozpočtu, statistiky ČNB a data zpracovávaná ČSÚ. Data jsou k dispozici obvykle za posledních více než 20 let, od prosince roku 1992. Zdroj dat: ČNB ARAD

