Other assets (Levels»Bond funds balance sheet) - ekonomika ČNB
Aktualizace dat Other assets (Levels»Bond funds balance sheet) v této aplikaci skončila 30.6.2023. Aktualizovná data časových řad najdete na stránkách nové aplikace z dat ARAD ČNB
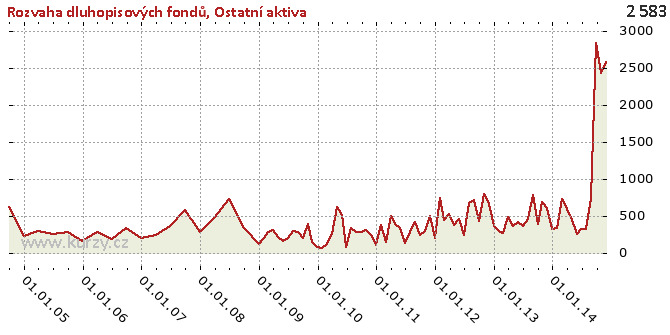
Graf hodnot, Bond funds balance sheet
Meziroční srovnání
Minima a maxima
| Typ | Období | Hodnota |
|---|---|---|
| Max | 30.09.2014 | 2 841.68 |
| Min | 31.01.2010 | 56.92 |
Historické hodnoty
| Období | Hodnota | Předchozí | Rozdíl | Změna | Před rokem | Rozdíl | Změna |
|---|---|---|---|---|---|---|---|
| 30.11.2014 | 2 583.61 | 2 435.72 | 147.89 | 6.07% | 598.53 | 1 985.08 | 331.66% |
| 31.10.2014 | 2 435.72 | 2 841.68 | - 405.96 | -14.29% | 686.24 | 1 749.48 | 254.94% |
| 30.09.2014 | 2 841.68 | 742.11 | 2 099.57 | 282.92% | 387.43 | 2 454.25 | 633.47% |
| 31.08.2014 | 742.11 | 322.88 | 419.23 | 129.84% | 781.43 | -39.31 | -5.03% |
| 31.07.2014 | 322.88 | 321.69 | 1.19 | 0.37% | 457.58 | - 134.70 | -29.44% |
| 30.06.2014 | 321.69 | 253.42 | 68.28 | 26.94% | 366.56 | -44.87 | -12.24% |
| 31.05.2014 | 253.42 | 438.47 | - 185.05 | -42.20% | 408.69 | - 155.28 | -37.99% |
| 30.04.2014 | 438.47 | 595.95 | - 157.48 | -26.43% | 358.69 | 79.78 | 22.24% |
| 31.03.2014 | 595.95 | 725.95 | - 130.00 | -17.91% | 482.60 | 113.35 | 23.49% |
| 28.02.2014 | 725.95 | 330.80 | 395.15 | 119.45% | 264.60 | 461.35 | 174.36% |
| 31.01.2014 | 330.80 | 317.60 | 13.20 | 4.16% | 295.43 | 35.38 | 11.98% |
| 31.12.2013 | 317.60 | 598.53 | - 280.93 | -46.94% | 360.18 | -42.58 | -11.82% |
| 30.11.2013 | 598.53 | 686.24 | -87.71 | -12.78% | 656.79 | -58.26 | -8.87% |
| 31.10.2013 | 686.24 | 387.43 | 298.81 | 77.13% | 791.87 | - 105.63 | -13.34% |
| 30.09.2013 | 387.43 | 781.43 | - 394.00 | -50.42% | 433.32 | -45.89 | -10.59% |
| 31.08.2013 | 781.43 | 457.58 | 323.85 | 70.78% | 715.17 | 66.25 | 9.26% |
| 31.07.2013 | 457.58 | 366.56 | 91.02 | 24.83% | 673.66 | - 216.08 | -32.08% |
| 30.06.2013 | 366.56 | 408.69 | -42.13 | -10.31% | 236.30 | 130.26 | 55.13% |
| 31.05.2013 | 408.69 | 358.69 | 50.00 | 13.94% | 452.35 | -43.65 | -9.65% |
| 30.04.2013 | 358.69 | 482.60 | - 123.91 | -25.68% | 371.44 | -12.75 | -3.43% |
| 31.03.2013 | 482.60 | 264.60 | 218.00 | 82.39% | 519.67 | -37.07 | -7.13% |
| 28.02.2013 | 264.60 | 295.43 | -30.83 | -10.43% | 441.30 | - 176.70 | -40.04% |
| 31.01.2013 | 295.43 | 360.18 | -64.75 | -17.98% | 740.71 | - 445.29 | -60.12% |
| 31.12.2012 | 360.18 | 656.79 | - 296.61 | -45.16% | 196.02 | 164.16 | 83.74% |
| 30.11.2012 | 656.79 | 791.87 | - 135.08 | -17.06% | 489.79 | 167.00 | 34.10% |
| 31.10.2012 | 791.87 | 433.32 | 358.54 | 82.74% | 297.72 | 494.15 | 165.98% |
| 30.09.2012 | 433.32 | 715.17 | - 281.85 | -39.41% | 237.51 | 195.81 | 82.44% |
| 31.08.2012 | 715.17 | 673.66 | 41.52 | 6.16% | 419.51 | 295.66 | 70.48% |
| 31.07.2012 | 673.66 | 236.30 | 437.36 | 185.09% | 284.34 | 389.32 | 136.92% |
| 30.06.2012 | 236.30 | 452.35 | - 216.04 | -47.76% | 123.70 | 112.60 | 91.03% |
| 31.05.2012 | 452.35 | 371.44 | 80.91 | 21.78% | 331.73 | 120.61 | 36.36% |
| 30.04.2012 | 371.44 | 519.67 | - 148.23 | -28.52% | 392.27 | -20.83 | -5.31% |
| 31.03.2012 | 519.67 | 441.30 | 78.37 | 17.76% | 492.48 | 27.19 | 5.52% |
| 29.02.2012 | 441.30 | 740.71 | - 299.42 | -40.42% | 137.38 | 303.92 | 221.22% |
| 31.01.2012 | 740.71 | 196.02 | 544.69 | 277.87% | 367.85 | 372.87 | 101.36% |
| 31.12.2011 | 196.02 | 489.79 | - 293.76 | -59.98% | 96.94 | 99.08 | 102.21% |
| 30.11.2011 | 489.79 | 297.72 | 192.07 | 64.51% | 235.34 | 254.45 | 108.12% |
| 31.10.2011 | 297.72 | 237.51 | 60.21 | 25.35% | 311.07 | -13.36 | -4.29% |
| 30.09.2011 | 237.51 | 419.51 | - 182.00 | -43.38% | 285.76 | -48.25 | -16.88% |
| 31.08.2011 | 419.51 | 284.34 | 135.17 | 47.54% | 275.17 | 144.34 | 52.46% |
| 31.07.2011 | 284.34 | 123.70 | 160.64 | 129.86% | 327.30 | -42.96 | -13.13% |
| 30.06.2011 | 123.70 | 331.73 | - 208.04 | -62.71% | 78.38 | 45.32 | 57.83% |
| 31.05.2011 | 331.73 | 392.27 | -60.54 | -15.43% | 503.87 | - 172.14 | -34.16% |
| 30.04.2011 | 392.27 | 492.48 | - 100.21 | -20.35% | 611.25 | - 218.98 | -35.82% |
| 31.03.2011 | 492.48 | 137.38 | 355.10 | 258.48% | 256.82 | 235.66 | 91.76% |
| 28.02.2011 | 137.38 | 367.85 | - 230.47 | -62.65% | 115.27 | 22.11 | 19.18% |
| 31.01.2011 | 367.85 | 96.94 | 270.90 | 279.45% | 56.92 | 310.93 | 546.30% |
| 31.12.2010 | 96.94 | 235.34 | - 138.40 | -58.81% | 71.61 | 25.34 | 35.38% |
| 30.11.2010 | 235.34 | 311.07 | -75.74 | -24.35% | 140.30 | 95.04 | 67.74% |
| 31.10.2010 | 311.07 | 285.76 | 25.32 | 8.86% | 392.47 | -81.39 | -20.74% |
| 30.09.2010 | 285.76 | 275.17 | 10.59 | 3.85% | 200.80 | 84.96 | 42.31% |
| 31.08.2010 | 275.17 | 327.30 | -52.13 | -15.93% | 275.82 | -0.66 | -0.24% |
| 31.07.2010 | 327.30 | 78.38 | 248.93 | 317.61% | 290.22 | 37.08 | 12.78% |
| 30.06.2010 | 78.38 | 503.87 | - 425.50 | -84.45% | 201.06 | - 122.69 | -61.02% |
| 31.05.2010 | 503.87 | 611.25 | - 107.38 | -17.57% | 162.54 | 341.33 | 210.00% |
| 30.04.2010 | 611.25 | 256.82 | 354.43 | 138.01% | 217.50 | 393.75 | 181.03% |
| 31.03.2010 | 256.82 | 115.27 | 141.55 | 122.80% | 312.47 | -55.65 | -17.81% |
| 28.02.2010 | 115.27 | 56.92 | 58.35 | 102.52% | 281.70 | - 166.44 | -59.08% |
| 31.01.2010 | 56.92 | 71.61 | -14.69 | -20.51% | 203.44 | - 146.53 | -72.02% |
| 31.12.2009 | 71.61 | 140.30 | -68.69 | -48.96% | 117.17 | -45.56 | -38.89% |
| 30.11.2009 | 140.30 | 392.47 | - 252.17 | -64.25% | 339.40 | - 199.10 | -58.66% |
| 31.10.2009 | 392.47 | 200.80 | 191.67 | 95.45% | 339.40 | 53.07 | 15.64% |
| 30.09.2009 | 200.80 | 275.82 | -75.03 | -27.20% | 339.40 | - 138.60 | -40.84% |
| 31.08.2009 | 275.82 | 290.22 | -14.40 | -4.96% | 724.62 | - 448.80 | -61.94% |
| 31.07.2009 | 290.22 | 201.06 | 89.16 | 44.34% | 724.62 | - 434.40 | -59.95% |
| 30.06.2009 | 201.06 | 162.54 | 38.52 | 23.70% | 724.62 | - 523.56 | -72.25% |
| 31.05.2009 | 162.54 | 217.50 | -54.96 | -25.27% | 473.30 | - 310.76 | -65.66% |
| 30.04.2009 | 217.50 | 312.47 | -94.97 | -30.39% | 473.30 | - 255.80 | -54.05% |
| 31.03.2009 | 312.47 | 281.70 | 30.77 | 10.92% | 473.30 | - 160.83 | -33.98% |
| 28.02.2009 | 281.70 | 203.44 | 78.26 | 38.47% | 273.02 | 8.69 | 3.18% |
| 31.01.2009 | 203.44 | 117.17 | 86.28 | 73.63% | 273.02 | -69.57 | -25.48% |
| 31.12.2008 | 117.17 | 339.40 | - 222.23 | -65.48% | 273.02 | - 155.85 | -57.08% |
| 30.09.2008 | 339.40 | 724.62 | - 385.22 | -53.16% | 581.27 | - 241.87 | -41.61% |
| 30.06.2008 | 724.62 | 473.30 | 251.32 | 53.10% | 357.65 | 366.97 | 102.61% |
| 31.03.2008 | 473.30 | 273.02 | 200.28 | 73.36% | 240.63 | 232.66 | 96.69% |
| 31.12.2007 | 273.02 | 581.27 | - 308.25 | -53.03% | 194.87 | 78.15 | 40.10% |
| 30.09.2007 | 581.27 | 357.65 | 223.62 | 62.53% | 327.84 | 253.43 | 77.30% |
| 30.06.2007 | 357.65 | 240.63 | 117.02 | 48.63% | 181.46 | 176.19 | 97.10% |
| 31.03.2007 | 240.63 | 194.87 | 45.77 | 23.49% | 284.14 | -43.51 | -15.31% |
| 31.12.2006 | 194.87 | 327.84 | - 132.98 | -40.56% | 155.18 | 39.69 | 25.57% |
| 30.09.2006 | 327.84 | 181.46 | 146.38 | 80.67% | 279.98 | 47.86 | 17.09% |
| 30.06.2006 | 181.46 | 284.14 | - 102.68 | -36.14% | 255.01 | -73.55 | -28.84% |
| 31.03.2006 | 284.14 | 155.18 | 128.96 | 83.10% | 294.01 | -9.87 | -3.36% |
| 31.12.2005 | 155.18 | 279.98 | - 124.80 | -44.58% | 228.38 | -73.21 | -32.05% |
| 30.09.2005 | 279.98 | 255.01 | 24.98 | 9.79% | 623.30 | - 343.32 | -55.08% |
| 30.06.2005 | 255.01 | 294.01 | -39.01 | -13.27% | - | - | - |
| 31.03.2005 | 294.01 | 228.38 | 65.63 | 28.73% | - | - | - |
| 31.12.2004 | 228.38 | 623.30 | - 394.92 | -63.36% | - | - | - |
| 30.09.2004 | 623.30 | - | - | - | - | - | - |
Graf jako obrázek

Podobné sestavy
Aplikace Ekonomika ČNB ze sekce makroekonomika zobrazuje časové řady hlavních makroekonomických údajů z ekonomiky ČR. Najdete zde přes 10.000 grafů různých hodnot od úrokových sazeb, přes statistiky státního rozpočtu, statistiky ČNB a data zpracovávaná ČSÚ. Data jsou k dispozici obvykle za posledních více než 20 let, od prosince roku 1992. Zdroj dat: ČNB ARAD

