Securities other than shares (Bond Funds Balance Sheet - Flows) - ekonomika ČNB
Aktualizace dat Securities other than shares (Bond Funds Balance Sheet - Flows) v této aplikaci skončila 30.6.2023. Aktualizovná data časových řad najdete na stránkách nové aplikace z dat ARAD ČNB
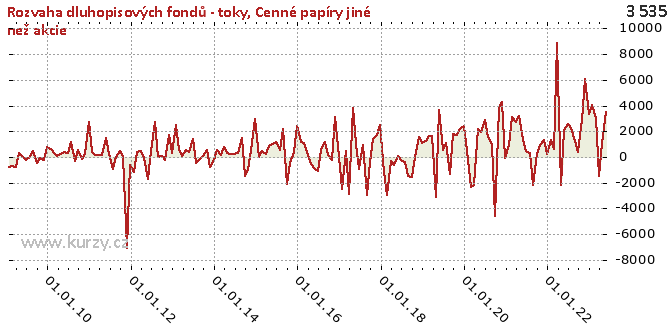
Graf hodnot, Bond Funds Balance Sheet - Flows
Meziroční srovnání
Minima a maxima
| Typ | Období | Hodnota |
|---|---|---|
| Max | 30.04.2017 | 3 829.77 |
| Min | 30.11.2011 | -7 110.83 |
Historické hodnoty
| Období | Hodnota | Předchozí | Rozdíl | Změna | Před rokem | Rozdíl | Změna |
|---|---|---|---|---|---|---|---|
| 30.06.2020 | 2 844.75 | 1 971.42 | 873.33 | 44.30% | 578.66 | 2 266.09 | 391.61% |
| 31.05.2020 | 1 971.42 | 2 141.82 | - 170.41 | -7.96% | 3 673.43 | -1 702.01 | -46.33% |
| 30.04.2020 | 2 141.82 | -2 195.43 | 4 337.26 | - 197.56% | -3 100.75 | 5 242.58 | - 169.07% |
| 31.03.2020 | -2 195.43 | -2 252.22 | 56.79 | -2.52% | 1 665.08 | -3 860.52 | - 231.85% |
| 29.02.2020 | -2 252.22 | 433.24 | -2 685.47 | - 619.85% | 1 661.95 | -3 914.17 | - 235.52% |
| 31.01.2020 | 433.24 | 2 381.71 | -1 948.47 | -81.81% | 1 220.24 | - 787.00 | -64.50% |
| 31.12.2019 | 2 381.71 | 2 161.57 | 220.15 | 10.18% | 1 075.58 | 1 306.13 | 121.44% |
| 30.11.2019 | 2 161.57 | 1 700.50 | 461.06 | 27.11% | 1 563.57 | 598.00 | 38.25% |
| 31.10.2019 | 1 700.50 | 1 752.24 | -51.74 | -2.95% | -2.61 | 1 703.11 | -65 278.23% |
| 30.09.2019 | 1 752.24 | -1 304.29 | 3 056.54 | - 234.34% | -1 584.25 | 3 336.49 | - 210.60% |
| 31.08.2019 | -1 304.29 | 1 128.31 | -2 432.60 | - 215.60% | -1 491.74 | 187.45 | -12.57% |
| 31.07.2019 | 1 128.31 | 578.66 | 549.64 | 94.99% | - 361.37 | 1 489.67 | - 412.23% |
| 30.06.2019 | 578.66 | 3 673.43 | -3 094.76 | -84.25% | - 228.14 | 806.80 | - 353.65% |
| 31.05.2019 | 3 673.43 | -3 100.75 | 6 774.18 | - 218.47% | 112.90 | 3 560.52 | 3 153.64% |
| 30.04.2019 | -3 100.75 | 1 665.08 | -4 765.84 | - 286.22% | - 631.92 | -2 468.84 | 390.69% |
| 31.03.2019 | 1 665.08 | 1 661.95 | 3.14 | 0.19% | - 297.89 | 1 962.97 | - 658.97% |
| 28.02.2019 | 1 661.95 | 1 220.24 | 441.71 | 36.20% | -2 940.77 | 4 602.72 | - 156.51% |
| 31.01.2019 | 1 220.24 | 1 075.58 | 144.66 | 13.45% | -1 140.81 | 2 361.05 | - 206.96% |
| 31.12.2018 | 1 075.58 | 1 563.57 | - 487.99 | -31.21% | 2 493.17 | -1 417.59 | -56.86% |
| 30.11.2018 | 1 563.57 | -2.61 | 1 566.17 | -60 029.70% | 1 688.67 | - 125.10 | -7.41% |
| 31.10.2018 | -2.61 | -1 584.25 | 1 581.64 | -99.84% | 1 438.17 | -1 440.78 | - 100.18% |
| 30.09.2018 | -1 584.25 | -1 491.74 | -92.51 | 6.20% | - 373.57 | -1 210.68 | 324.08% |
| 31.08.2018 | -1 491.74 | - 361.37 | -1 130.37 | 312.80% | -2 958.76 | 1 467.02 | -49.58% |
| 31.07.2018 | - 361.37 | - 228.14 | - 133.23 | 58.40% | 941.96 | -1 303.33 | - 138.36% |
| 30.06.2018 | - 228.14 | 112.90 | - 341.04 | - 302.07% | - 949.62 | 721.48 | -75.98% |
| 31.05.2018 | 112.90 | - 631.92 | 744.82 | - 117.87% | 1 011.46 | - 898.55 | -88.84% |
| 30.04.2018 | - 631.92 | - 297.89 | - 334.03 | 112.13% | 3 829.77 | -4 461.69 | - 116.50% |
| 31.03.2018 | - 297.89 | -2 940.77 | 2 642.89 | -89.87% | -2 851.38 | 2 553.49 | -89.55% |
| 28.02.2018 | -2 940.77 | -1 140.81 | -1 799.96 | 157.78% | 438.14 | -3 378.91 | - 771.20% |
| 31.01.2018 | -1 140.81 | 2 493.17 | -3 633.97 | - 145.76% | -2 484.18 | 1 343.37 | -54.08% |
| 31.12.2017 | 2 493.17 | 1 688.67 | 804.50 | 47.64% | -29.62 | 2 522.79 | -8 516.61% |
| 30.11.2017 | 1 688.67 | 1 438.17 | 250.49 | 17.42% | 3 109.60 | -1 420.94 | -45.70% |
| 31.10.2017 | 1 438.17 | - 373.57 | 1 811.75 | - 484.98% | - 216.17 | 1 654.34 | - 765.30% |
| 30.09.2017 | - 373.57 | -2 958.76 | 2 585.18 | -87.37% | 119.38 | - 492.95 | - 412.93% |
| 31.08.2017 | -2 958.76 | 941.96 | -3 900.72 | - 414.11% | 1 168.78 | -4 127.54 | - 353.15% |
| 31.07.2017 | 941.96 | - 949.62 | 1 891.57 | - 199.19% | 519.56 | 422.40 | 81.30% |
| 30.06.2017 | - 949.62 | 1 011.46 | -1 961.07 | - 193.89% | -1 054.28 | 104.67 | -9.93% |
| 31.05.2017 | 1 011.46 | 3 829.77 | -2 818.31 | -73.59% | - 822.72 | 1 834.17 | - 222.94% |
| 30.04.2017 | 3 829.77 | -2 851.38 | 6 681.15 | - 234.31% | - 544.79 | 4 374.56 | - 802.98% |
| 31.03.2017 | -2 851.38 | 438.14 | -3 289.51 | - 750.80% | 415.88 | -3 267.26 | - 785.62% |
| 28.02.2017 | 438.14 | -2 484.18 | 2 922.31 | - 117.64% | 1 082.16 | - 644.02 | -59.51% |
| 31.01.2017 | -2 484.18 | -29.62 | -2 454.55 | 8 286.25% | 1 135.67 | -3 619.85 | - 318.74% |
| 31.12.2016 | -29.62 | 3 109.60 | -3 139.22 | - 100.95% | 2 435.42 | -2 465.04 | - 101.22% |
| 30.11.2016 | 3 109.60 | - 216.17 | 3 325.77 | -1 538.51% | 419.73 | 2 689.87 | 640.85% |
| 31.10.2016 | - 216.17 | 119.38 | - 335.55 | - 281.07% | - 500.94 | 284.77 | -56.85% |
| 30.09.2016 | 119.38 | 1 168.78 | -1 049.40 | -89.79% | -2 121.15 | 2 240.53 | - 105.63% |
| 31.08.2016 | 1 168.78 | 519.56 | 649.22 | 124.96% | 2 166.32 | - 997.54 | -46.05% |
| 31.07.2016 | 519.56 | -1 054.28 | 1 573.84 | - 149.28% | 516.46 | 3.10 | 0.60% |
| 30.06.2016 | -1 054.28 | - 822.72 | - 231.56 | 28.15% | 1 148.06 | -2 202.34 | - 191.83% |
| 31.05.2016 | - 822.72 | - 544.79 | - 277.93 | 51.02% | 1 008.26 | -1 830.97 | - 181.60% |
| 30.04.2016 | - 544.79 | 415.88 | - 960.67 | - 231.00% | 836.63 | -1 381.42 | - 165.12% |
| 31.03.2016 | 415.88 | 1 082.16 | - 666.27 | -61.57% | 197.95 | 217.93 | 110.09% |
| 29.02.2016 | 1 082.16 | 1 135.67 | -53.52 | -4.71% | 487.42 | 594.74 | 122.02% |
| 31.01.2016 | 1 135.67 | 2 435.42 | -1 299.75 | -53.37% | -28.69 | 1 164.37 | -4 058.02% |
| 31.12.2015 | 2 435.42 | 419.73 | 2 015.69 | 480.23% | 2 953.80 | - 518.38 | -17.55% |
| 30.11.2015 | 419.73 | - 500.94 | 920.68 | - 183.79% | 1 068.99 | - 649.26 | -60.74% |
| 31.10.2015 | - 500.94 | -2 121.15 | 1 620.21 | -76.38% | - 995.14 | 494.20 | -49.66% |
| 30.09.2015 | -2 121.15 | 2 166.32 | -4 287.48 | - 197.91% | -1 465.99 | - 655.16 | 44.69% |
| 31.08.2015 | 2 166.32 | 516.46 | 1 649.87 | 319.46% | 1 516.97 | 649.35 | 42.81% |
| 31.07.2015 | 516.46 | 1 148.06 | - 631.60 | -55.01% | 343.98 | 172.48 | 50.14% |
| 30.06.2015 | 1 148.06 | 1 008.26 | 139.80 | 13.87% | 236.69 | 911.36 | 385.04% |
| 31.05.2015 | 1 008.26 | 836.63 | 171.63 | 20.51% | 239.71 | 768.55 | 320.62% |
| 30.04.2015 | 836.63 | 197.95 | 638.68 | 322.64% | 315.07 | 521.56 | 165.54% |
| 31.03.2015 | 197.95 | 487.42 | - 289.47 | -59.39% | 781.98 | - 584.03 | -74.69% |
| 28.02.2015 | 487.42 | -28.69 | 516.11 | -1 798.75% | 190.35 | 297.07 | 156.06% |
| 31.01.2015 | -28.69 | 2 953.80 | -2 982.49 | - 100.97% | 529.93 | - 558.62 | - 105.41% |
| 31.12.2014 | 2 953.80 | 1 068.99 | 1 884.81 | 176.32% | - 207.53 | 3 161.32 | -1 523.32% |
| 30.11.2014 | 1 068.99 | - 995.14 | 2 064.13 | - 207.42% | - 813.47 | 1 882.45 | - 231.41% |
| 31.10.2014 | - 995.14 | -1 465.99 | 470.85 | -32.12% | 522.23 | -1 517.37 | - 290.56% |
| 30.09.2014 | -1 465.99 | 1 516.97 | -2 982.96 | - 196.64% | 47.05 | -1 513.04 | -3 215.81% |
| 31.08.2014 | 1 516.97 | 343.98 | 1 172.99 | 341.00% | - 154.56 | 1 671.54 | -1 081.45% |
| 31.07.2014 | 343.98 | 236.69 | 107.29 | 45.33% | - 491.93 | 835.91 | - 169.93% |
| 30.06.2014 | 236.69 | 239.71 | -3.01 | -1.26% | 1 430.22 | -1 193.52 | -83.45% |
| 31.05.2014 | 239.71 | 315.07 | -75.36 | -23.92% | 414.77 | - 175.06 | -42.21% |
| 30.04.2014 | 315.07 | 781.98 | - 466.91 | -59.71% | 508.67 | - 193.60 | -38.06% |
| 31.03.2014 | 781.98 | 190.35 | 591.63 | 310.81% | 73.11 | 708.88 | 969.67% |
| 28.02.2014 | 190.35 | 529.93 | - 339.57 | -64.08% | 510.96 | - 320.61 | -62.75% |
| 31.01.2014 | 529.93 | - 207.53 | 737.46 | - 355.35% | 2 476.42 | -1 946.49 | -78.60% |
| 31.12.2013 | - 207.53 | - 813.47 | 605.94 | -74.49% | 343.50 | - 551.03 | - 160.42% |
| 30.11.2013 | - 813.47 | 522.23 | -1 335.69 | - 255.77% | 1 720.76 | -2 534.23 | - 147.27% |
| 31.10.2013 | 522.23 | 47.05 | 475.18 | 1 009.94% | - 196.77 | 719.00 | - 365.40% |
| 30.09.2013 | 47.05 | - 154.56 | 201.61 | - 130.44% | 60.41 | -13.36 | -22.11% |
| 31.08.2013 | - 154.56 | - 491.93 | 337.37 | -68.58% | -21.44 | - 133.12 | 620.91% |
| 31.07.2013 | - 491.93 | 1 430.22 | -1 922.15 | - 134.40% | 2 753.28 | -3 245.21 | - 117.87% |
| 30.06.2013 | 1 430.22 | 414.77 | 1 015.45 | 244.82% | 438.21 | 992.01 | 226.38% |
| 31.05.2013 | 414.77 | 508.67 | -93.90 | -18.46% | -1 703.46 | 2 118.23 | - 124.35% |
| 30.04.2013 | 508.67 | 73.11 | 435.57 | 595.81% | - 103.93 | 612.60 | - 589.45% |
| 31.03.2013 | 73.11 | 510.96 | - 437.85 | -85.69% | 481.57 | - 408.46 | -84.82% |
| 28.02.2013 | 510.96 | 2 476.42 | -1 965.46 | -79.37% | 391.36 | 119.60 | 30.56% |
| 31.01.2013 | 2 476.42 | 343.50 | 2 132.92 | 620.93% | -1 203.98 | 3 680.41 | - 305.69% |
| 31.12.2012 | 343.50 | 1 720.76 | -1 377.26 | -80.04% | - 583.78 | 927.28 | - 158.84% |
| 30.11.2012 | 1 720.76 | - 196.77 | 1 917.53 | - 974.50% | -7 110.83 | 8 831.59 | - 124.20% |
| 31.10.2012 | - 196.77 | 60.41 | - 257.18 | - 425.75% | 11.46 | - 208.23 | -1 817.17% |
| 30.09.2012 | 60.41 | -21.44 | 81.84 | - 381.74% | 450.06 | - 389.66 | -86.58% |
| 31.08.2012 | -21.44 | 2 753.28 | -2 774.72 | - 100.78% | 17.42 | -38.86 | - 223.08% |
| 31.07.2012 | 2 753.28 | 438.21 | 2 315.07 | 528.31% | - 965.56 | 3 718.84 | - 385.15% |
| 30.06.2012 | 438.21 | -1 703.46 | 2 141.66 | - 125.72% | 237.72 | 200.49 | 84.34% |
| 31.05.2012 | -1 703.46 | - 103.93 | -1 599.53 | 1 539.11% | 1 512.82 | -3 216.28 | - 212.60% |
| 30.04.2012 | - 103.93 | 481.57 | - 585.49 | - 121.58% | 154.39 | - 258.31 | - 167.32% |
| 31.03.2012 | 481.57 | 391.36 | 90.21 | 23.05% | 157.43 | 324.14 | 205.89% |
| 29.02.2012 | 391.36 | -1 203.98 | 1 595.35 | - 132.51% | 148.70 | 242.66 | 163.19% |
| 31.01.2012 | -1 203.98 | - 583.78 | - 620.21 | 106.24% | 365.16 | -1 569.15 | - 429.71% |
| 31.12.2011 | - 583.78 | -7 110.83 | 6 527.06 | -91.79% | 2 742.74 | -3 326.52 | - 121.28% |
| 30.11.2011 | -7 110.83 | 11.46 | -7 122.29 | -62 154.55% | 246.50 | -7 357.34 | -2 984.66% |
| 31.10.2011 | 11.46 | 450.06 | - 438.60 | -97.45% | - 127.39 | 138.85 | - 109.00% |
| 30.09.2011 | 450.06 | 17.42 | 432.64 | 2 483.74% | 508.75 | -58.69 | -11.54% |
| 31.08.2011 | 17.42 | - 965.56 | 982.98 | - 101.80% | - 319.51 | 336.93 | - 105.45% |
| 31.07.2011 | - 965.56 | 237.72 | -1 203.28 | - 506.18% | 1 128.86 | -2 094.42 | - 185.53% |
| 30.06.2011 | 237.72 | 1 512.82 | -1 275.10 | -84.29% | 281.26 | -43.54 | -15.48% |
| 31.05.2011 | 1 512.82 | 154.39 | 1 358.43 | 879.89% | 354.07 | 1 158.75 | 327.26% |
| 30.04.2011 | 154.39 | 157.43 | -3.04 | -1.93% | 260.72 | - 106.33 | -40.78% |
| 31.03.2011 | 157.43 | 148.70 | 8.73 | 5.87% | 55.21 | 102.22 | 185.16% |
| 28.02.2011 | 148.70 | 365.16 | - 216.47 | -59.28% | 310.18 | - 161.48 | -52.06% |
| 31.01.2011 | 365.16 | 2 742.74 | -2 377.58 | -86.69% | 607.34 | - 242.18 | -39.88% |
| 31.12.2010 | 2 742.74 | 246.50 | 2 496.24 | 1 012.65% | 806.06 | 1 936.68 | 240.26% |
| 30.11.2010 | 246.50 | - 127.39 | 373.90 | - 293.50% | - 257.61 | 504.12 | - 195.69% |
| 31.10.2010 | - 127.39 | 508.75 | - 636.14 | - 125.04% | -90.68 | -36.71 | 40.49% |
| 30.09.2010 | 508.75 | - 319.51 | 828.26 | - 259.23% | - 457.79 | 966.54 | - 211.13% |
| 31.08.2010 | - 319.51 | 1 128.86 | -1 448.37 | - 128.30% | 442.47 | - 761.98 | - 172.21% |
| 31.07.2010 | 1 128.86 | 281.26 | 847.61 | 301.36% | 25.22 | 1 103.64 | 4 376.24% |
| 30.06.2010 | 281.26 | 354.07 | -72.81 | -20.56% | - 204.40 | 485.66 | - 237.60% |
| 31.05.2010 | 354.07 | 260.72 | 93.35 | 35.81% | 28.55 | 325.52 | 1 140.23% |
| 30.04.2010 | 260.72 | 55.21 | 205.51 | 372.25% | 277.83 | -17.11 | -6.16% |
| 31.03.2010 | 55.21 | 310.18 | - 254.97 | -82.20% | - 749.74 | 804.95 | - 107.36% |
| 28.02.2010 | 310.18 | 607.34 | - 297.17 | -48.93% | - 683.04 | 993.22 | - 145.41% |
| 31.01.2010 | 607.34 | 806.06 | - 198.72 | -24.65% | - 779.92 | 1 387.26 | - 177.87% |
| 31.12.2009 | 806.06 | - 257.61 | 1 063.67 | - 412.90% | - | - | - |
| 30.11.2009 | - 257.61 | -90.68 | - 166.93 | 184.09% | - | - | - |
| 31.10.2009 | -90.68 | - 457.79 | 367.11 | -80.19% | - | - | - |
| 30.09.2009 | - 457.79 | 442.47 | - 900.25 | - 203.46% | - | - | - |
| 31.08.2009 | 442.47 | 25.22 | 417.25 | 1 654.50% | - | - | - |
| 31.07.2009 | 25.22 | - 204.40 | 229.62 | - 112.34% | - | - | - |
| 30.06.2009 | - 204.40 | 28.55 | - 232.95 | - 815.95% | - | - | - |
| 31.05.2009 | 28.55 | 277.83 | - 249.28 | -89.72% | - | - | - |
| 30.04.2009 | 277.83 | - 749.74 | 1 027.57 | - 137.06% | - | - | - |
| 31.03.2009 | - 749.74 | - 683.04 | -66.70 | 9.76% | - | - | - |
| 28.02.2009 | - 683.04 | - 779.92 | 96.87 | -12.42% | - | - | - |
| 31.01.2009 | - 779.92 | - | - | - | - | - | - |
Graf jako obrázek

Podobné sestavy
Aplikace Ekonomika ČNB ze sekce makroekonomika zobrazuje časové řady hlavních makroekonomických údajů z ekonomiky ČR. Najdete zde přes 10.000 grafů různých hodnot od úrokových sazeb, přes statistiky státního rozpočtu, statistiky ČNB a data zpracovávaná ČSÚ. Data jsou k dispozici obvykle za posledních více než 20 let, od prosince roku 1992. Zdroj dat: ČNB ARAD

