Investment fund shares/units (Equity funds balance sheet) - ekonomika ČNB
Aktualizace dat Investment fund shares/units (Equity funds balance sheet) v této aplikaci skončila 30.6.2023. Aktualizovná data časových řad najdete na stránkách nové aplikace z dat ARAD ČNB
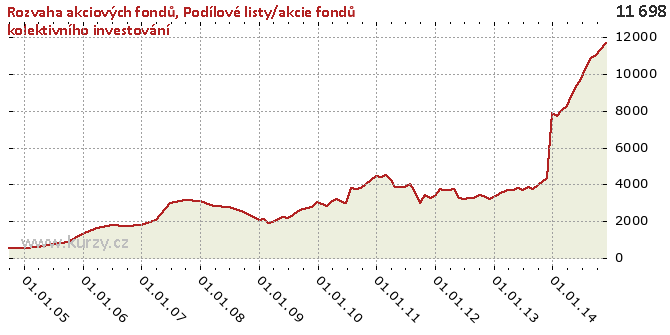
Graf hodnot, Equity funds balance sheet
Meziroční srovnání
Minima a maxima
| Typ | Období | Hodnota |
|---|---|---|
| Max | 30.11.2014 | 11 698.74 |
| Min | 31.12.2004 | 525.21 |
Historické hodnoty
| Období | Hodnota | Předchozí | Rozdíl | Změna | Před rokem | Rozdíl | Změna |
|---|---|---|---|---|---|---|---|
| 30.11.2014 | 11 698.74 | 11 363.87 | 334.87 | 2.95% | 4 341.55 | 7 357.19 | 169.46% |
| 31.10.2014 | 11 363.87 | 10 997.81 | 366.06 | 3.33% | 4 140.58 | 7 223.29 | 174.45% |
| 30.09.2014 | 10 997.81 | 10 859.62 | 138.19 | 1.27% | 3 970.14 | 7 027.68 | 177.01% |
| 31.08.2014 | 10 859.62 | 10 348.86 | 510.76 | 4.94% | 3 771.81 | 7 087.81 | 187.92% |
| 31.07.2014 | 10 348.86 | 9 726.34 | 622.52 | 6.40% | 3 839.74 | 6 509.12 | 169.52% |
| 30.06.2014 | 9 726.34 | 9 423.13 | 303.21 | 3.22% | 3 716.39 | 6 009.95 | 161.71% |
| 31.05.2014 | 9 423.13 | 8 884.43 | 538.70 | 6.06% | 3 793.57 | 5 629.56 | 148.40% |
| 30.04.2014 | 8 884.43 | 8 271.70 | 612.73 | 7.41% | 3 673.85 | 5 210.57 | 141.83% |
| 31.03.2014 | 8 271.70 | 8 027.82 | 243.88 | 3.04% | 3 679.97 | 4 591.73 | 124.78% |
| 28.02.2014 | 8 027.82 | 7 740.24 | 287.58 | 3.72% | 3 570.73 | 4 457.09 | 124.82% |
| 31.01.2014 | 7 740.24 | 7 882.40 | - 142.16 | -1.80% | 3 461.64 | 4 278.60 | 123.60% |
| 31.12.2013 | 7 882.40 | 4 341.55 | 3 540.85 | 81.56% | 3 339.00 | 4 543.40 | 136.07% |
| 30.11.2013 | 4 341.55 | 4 140.58 | 200.97 | 4.85% | 3 223.83 | 1 117.72 | 34.67% |
| 31.10.2013 | 4 140.58 | 3 970.14 | 170.44 | 4.29% | 3 368.74 | 771.84 | 22.91% |
| 30.09.2013 | 3 970.14 | 3 771.81 | 198.33 | 5.26% | 3 404.76 | 565.37 | 16.61% |
| 31.08.2013 | 3 771.81 | 3 839.74 | -67.93 | -1.77% | 3 287.38 | 484.43 | 14.74% |
| 31.07.2013 | 3 839.74 | 3 716.39 | 123.35 | 3.32% | 3 237.18 | 602.55 | 18.61% |
| 30.06.2013 | 3 716.39 | 3 793.57 | -77.19 | -2.03% | 3 190.62 | 525.76 | 16.48% |
| 31.05.2013 | 3 793.57 | 3 673.85 | 119.72 | 3.26% | 3 258.29 | 535.28 | 16.43% |
| 30.04.2013 | 3 673.85 | 3 679.97 | -6.12 | -0.17% | 3 731.99 | -58.13 | -1.56% |
| 31.03.2013 | 3 679.97 | 3 570.73 | 109.23 | 3.06% | 3 710.88 | -30.91 | -0.83% |
| 28.02.2013 | 3 570.73 | 3 461.64 | 109.09 | 3.15% | 3 678.74 | - 108.01 | -2.94% |
| 31.01.2013 | 3 461.64 | 3 339.00 | 122.64 | 3.67% | 3 733.41 | - 271.77 | -7.28% |
| 31.12.2012 | 3 339.00 | 3 223.83 | 115.17 | 3.57% | 3 370.60 | -31.60 | -0.94% |
| 30.11.2012 | 3 223.83 | 3 368.74 | - 144.91 | -4.30% | 3 265.47 | -41.65 | -1.28% |
| 31.10.2012 | 3 368.74 | 3 404.76 | -36.02 | -1.06% | 3 449.94 | -81.20 | -2.35% |
| 30.09.2012 | 3 404.76 | 3 287.38 | 117.39 | 3.57% | 3 017.59 | 387.17 | 12.83% |
| 31.08.2012 | 3 287.38 | 3 237.18 | 50.19 | 1.55% | 3 566.37 | - 278.99 | -7.82% |
| 31.07.2012 | 3 237.18 | 3 190.62 | 46.56 | 1.46% | 4 028.85 | - 791.67 | -19.65% |
| 30.06.2012 | 3 190.62 | 3 258.29 | -67.67 | -2.08% | 3 835.78 | - 645.15 | -16.82% |
| 31.05.2012 | 3 258.29 | 3 731.99 | - 473.70 | -12.69% | 3 874.53 | - 616.24 | -15.90% |
| 30.04.2012 | 3 731.99 | 3 710.88 | 21.11 | 0.57% | 3 855.71 | - 123.73 | -3.21% |
| 31.03.2012 | 3 710.88 | 3 678.74 | 32.13 | 0.87% | 4 238.74 | - 527.86 | -12.45% |
| 29.02.2012 | 3 678.74 | 3 733.41 | -54.66 | -1.46% | 4 491.06 | - 812.31 | -18.09% |
| 31.01.2012 | 3 733.41 | 3 370.60 | 362.81 | 10.76% | 4 379.84 | - 646.43 | -14.76% |
| 31.12.2011 | 3 370.60 | 3 265.47 | 105.12 | 3.22% | 4 453.73 | -1 083.13 | -24.32% |
| 30.11.2011 | 3 265.47 | 3 449.94 | - 184.46 | -5.35% | 4 256.02 | - 990.54 | -23.27% |
| 31.10.2011 | 3 449.94 | 3 017.59 | 432.35 | 14.33% | 4 043.03 | - 593.10 | -14.67% |
| 30.09.2011 | 3 017.59 | 3 566.37 | - 548.77 | -15.39% | 3 831.64 | - 814.05 | -21.25% |
| 31.08.2011 | 3 566.37 | 4 028.85 | - 462.48 | -11.48% | 3 752.43 | - 186.06 | -4.96% |
| 31.07.2011 | 4 028.85 | 3 835.78 | 193.07 | 5.03% | 3 791.27 | 237.58 | 6.27% |
| 30.06.2011 | 3 835.78 | 3 874.53 | -38.75 | -1.00% | 3 007.68 | 828.09 | 27.53% |
| 31.05.2011 | 3 874.53 | 3 855.71 | 18.82 | 0.49% | 3 050.45 | 824.08 | 27.01% |
| 30.04.2011 | 3 855.71 | 4 238.74 | - 383.03 | -9.04% | 3 213.80 | 641.91 | 19.97% |
| 31.03.2011 | 4 238.74 | 4 491.06 | - 252.32 | -5.62% | 3 078.57 | 1 160.17 | 37.69% |
| 28.02.2011 | 4 491.06 | 4 379.84 | 111.22 | 2.54% | 2 849.01 | 1 642.05 | 57.64% |
| 31.01.2011 | 4 379.84 | 4 453.73 | -73.89 | -1.66% | 2 939.31 | 1 440.53 | 49.01% |
| 31.12.2010 | 4 453.73 | 4 256.02 | 197.72 | 4.65% | 3 034.26 | 1 419.47 | 46.78% |
| 30.11.2010 | 4 256.02 | 4 043.03 | 212.98 | 5.27% | 2 773.51 | 1 482.51 | 53.45% |
| 31.10.2010 | 4 043.03 | 3 831.64 | 211.39 | 5.52% | 2 739.74 | 1 303.30 | 47.57% |
| 30.09.2010 | 3 831.64 | 3 752.43 | 79.21 | 2.11% | 2 640.34 | 1 191.30 | 45.12% |
| 31.08.2010 | 3 752.43 | 3 791.27 | -38.84 | -1.02% | 2 540.58 | 1 211.85 | 47.70% |
| 31.07.2010 | 3 791.27 | 3 007.68 | 783.59 | 26.05% | 2 358.05 | 1 433.22 | 60.78% |
| 30.06.2010 | 3 007.68 | 3 050.45 | -42.77 | -1.40% | 2 183.11 | 824.57 | 37.77% |
| 31.05.2010 | 3 050.45 | 3 213.80 | - 163.35 | -5.08% | 2 221.98 | 828.48 | 37.29% |
| 30.04.2010 | 3 213.80 | 3 078.57 | 135.24 | 4.39% | 2 126.49 | 1 087.31 | 51.13% |
| 31.03.2010 | 3 078.57 | 2 849.01 | 229.56 | 8.06% | 1 932.23 | 1 146.34 | 59.33% |
| 28.02.2010 | 2 849.01 | 2 939.31 | -90.30 | -3.07% | 1 902.75 | 946.26 | 49.73% |
| 31.01.2010 | 2 939.31 | 3 034.26 | -94.94 | -3.13% | 2 130.87 | 808.44 | 37.94% |
| 31.12.2009 | 3 034.26 | 2 773.51 | 260.75 | 9.40% | 2 084.00 | 950.26 | 45.60% |
| 30.11.2009 | 2 773.51 | 2 739.74 | 33.77 | 1.23% | 2 514.71 | 258.80 | 10.29% |
| 31.10.2009 | 2 739.74 | 2 640.34 | 99.39 | 3.76% | 2 514.71 | 225.03 | 8.95% |
| 30.09.2009 | 2 640.34 | 2 540.58 | 99.77 | 3.93% | 2 514.71 | 125.64 | 5.00% |
| 31.08.2009 | 2 540.58 | 2 358.05 | 182.53 | 7.74% | 2 760.66 | - 220.08 | -7.97% |
| 31.07.2009 | 2 358.05 | 2 183.11 | 174.93 | 8.01% | 2 760.66 | - 402.61 | -14.58% |
| 30.06.2009 | 2 183.11 | 2 221.98 | -38.86 | -1.75% | 2 760.66 | - 577.54 | -20.92% |
| 31.05.2009 | 2 221.98 | 2 126.49 | 95.48 | 4.49% | 2 851.18 | - 629.20 | -22.07% |
| 30.04.2009 | 2 126.49 | 1 932.23 | 194.26 | 10.05% | 2 851.18 | - 724.69 | -25.42% |
| 31.03.2009 | 1 932.23 | 1 902.75 | 29.49 | 1.55% | 2 851.18 | - 918.95 | -32.23% |
| 28.02.2009 | 1 902.75 | 2 130.87 | - 228.13 | -10.71% | 3 074.88 | -1 172.13 | -38.12% |
| 31.01.2009 | 2 130.87 | 2 084.00 | 46.88 | 2.25% | 3 074.88 | - 944.00 | -30.70% |
| 31.12.2008 | 2 084.00 | 2 514.71 | - 430.71 | -17.13% | 3 074.88 | - 990.88 | -32.23% |
| 30.09.2008 | 2 514.71 | 2 760.66 | - 245.95 | -8.91% | 3 127.68 | - 612.97 | -19.60% |
| 30.06.2008 | 2 760.66 | 2 851.18 | -90.52 | -3.17% | 3 012.75 | - 252.09 | -8.37% |
| 31.03.2008 | 2 851.18 | 3 074.88 | - 223.70 | -7.27% | 2 048.80 | 802.38 | 39.16% |
| 31.12.2007 | 3 074.88 | 3 127.68 | -52.80 | -1.69% | 1 802.05 | 1 272.83 | 70.63% |
| 30.09.2007 | 3 127.68 | 3 012.75 | 114.92 | 3.81% | 1 764.26 | 1 363.42 | 77.28% |
| 30.06.2007 | 3 012.75 | 2 048.80 | 963.95 | 47.05% | 1 769.23 | 1 243.52 | 70.29% |
| 31.03.2007 | 2 048.80 | 1 802.05 | 246.75 | 13.69% | 1 625.19 | 423.61 | 26.07% |
| 31.12.2006 | 1 802.05 | 1 764.26 | 37.80 | 2.14% | 1 301.04 | 501.01 | 38.51% |
| 30.09.2006 | 1 764.26 | 1 769.23 | -4.98 | -0.28% | 881.00 | 883.26 | 100.26% |
| 30.06.2006 | 1 769.23 | 1 625.19 | 144.04 | 8.86% | 738.73 | 1 030.50 | 139.50% |
| 31.03.2006 | 1 625.19 | 1 301.04 | 324.15 | 24.91% | 626.41 | 998.78 | 159.45% |
| 31.12.2005 | 1 301.04 | 881.00 | 420.05 | 47.68% | 525.21 | 775.83 | 147.72% |
| 30.09.2005 | 881.00 | 738.73 | 142.27 | 19.26% | 536.85 | 344.15 | 64.11% |
| 30.06.2005 | 738.73 | 626.41 | 112.32 | 17.93% | - | - | - |
| 31.03.2005 | 626.41 | 525.21 | 101.20 | 19.27% | - | - | - |
| 31.12.2004 | 525.21 | 536.85 | -11.63 | -2.17% | - | - | - |
| 30.09.2004 | 536.85 | - | - | - | - | - | - |
Graf jako obrázek

Podobné sestavy
Aplikace Ekonomika ČNB ze sekce makroekonomika zobrazuje časové řady hlavních makroekonomických údajů z ekonomiky ČR. Najdete zde přes 10.000 grafů různých hodnot od úrokových sazeb, přes statistiky státního rozpočtu, statistiky ČNB a data zpracovávaná ČSÚ. Data jsou k dispozici obvykle za posledních více než 20 let, od prosince roku 1992. Zdroj dat: ČNB ARAD

