Mutual funds shares/units issued (Equity funds balance sheet) - ekonomika ČNB
Aktualizace dat Mutual funds shares/units issued (Equity funds balance sheet) v této aplikaci skončila 30.6.2023. Aktualizovná data časových řad najdete na stránkách nové aplikace z dat ARAD ČNB
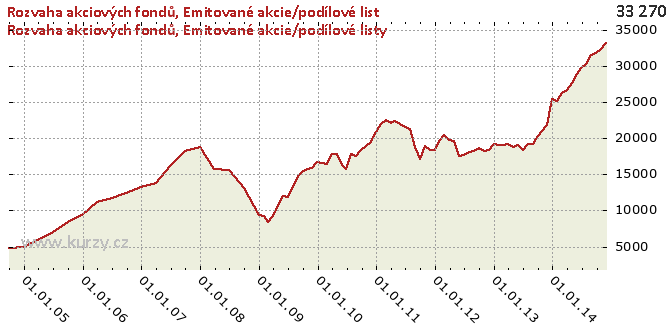
Graf hodnot, Equity funds balance sheet
Meziroční srovnání
Minima a maxima
| Typ | Období | Hodnota |
|---|---|---|
| Max | 30.11.2014 | 33 270.84 |
| Min | 30.09.2004 | 4 736.96 |
Historické hodnoty
| Období | Hodnota | Předchozí | Rozdíl | Změna | Před rokem | Rozdíl | Změna |
|---|---|---|---|---|---|---|---|
| 30.11.2014 | 33 270.84 | 32 320.18 | 950.66 | 2.94% | 21 806.19 | 11 464.65 | 52.58% |
| 31.10.2014 | 32 320.18 | 31 780.14 | 540.04 | 1.70% | 21 011.00 | 11 309.18 | 53.83% |
| 30.09.2014 | 31 780.14 | 31 576.58 | 203.56 | 0.64% | 20 256.14 | 11 524.00 | 56.89% |
| 31.08.2014 | 31 576.58 | 30 249.53 | 1 327.05 | 4.39% | 19 191.42 | 12 385.16 | 64.53% |
| 31.07.2014 | 30 249.53 | 29 755.89 | 493.64 | 1.66% | 19 264.33 | 10 985.20 | 57.02% |
| 30.06.2014 | 29 755.89 | 28 965.24 | 790.65 | 2.73% | 18 364.62 | 11 391.27 | 62.03% |
| 31.05.2014 | 28 965.24 | 27 668.85 | 1 296.39 | 4.69% | 19 065.64 | 9 899.59 | 51.92% |
| 30.04.2014 | 27 668.85 | 26 663.65 | 1 005.20 | 3.77% | 18 791.08 | 8 877.77 | 47.24% |
| 31.03.2014 | 26 663.65 | 26 286.37 | 377.28 | 1.44% | 19 142.78 | 7 520.87 | 39.29% |
| 28.02.2014 | 26 286.37 | 25 204.07 | 1 082.30 | 4.29% | 19 042.03 | 7 244.34 | 38.04% |
| 31.01.2014 | 25 204.07 | 25 443.50 | - 239.43 | -0.94% | 19 019.28 | 6 184.79 | 32.52% |
| 31.12.2013 | 25 443.50 | 21 806.19 | 3 637.32 | 16.68% | 19 169.47 | 6 274.04 | 32.73% |
| 30.11.2013 | 21 806.19 | 21 011.00 | 795.18 | 3.78% | 18 314.81 | 3 491.38 | 19.06% |
| 31.10.2013 | 21 011.00 | 20 256.14 | 754.87 | 3.73% | 18 281.48 | 2 729.52 | 14.93% |
| 30.09.2013 | 20 256.14 | 19 191.42 | 1 064.71 | 5.55% | 18 633.91 | 1 622.22 | 8.71% |
| 31.08.2013 | 19 191.42 | 19 264.33 | -72.90 | -0.38% | 18 265.21 | 926.21 | 5.07% |
| 31.07.2013 | 19 264.33 | 18 364.62 | 899.71 | 4.90% | 18 050.23 | 1 214.10 | 6.73% |
| 30.06.2013 | 18 364.62 | 19 065.64 | - 701.03 | -3.68% | 17 709.04 | 655.58 | 3.70% |
| 31.05.2013 | 19 065.64 | 18 791.08 | 274.57 | 1.46% | 17 493.24 | 1 572.40 | 8.99% |
| 30.04.2013 | 18 791.08 | 19 142.78 | - 351.70 | -1.84% | 19 693.95 | - 902.87 | -4.58% |
| 31.03.2013 | 19 142.78 | 19 042.03 | 100.74 | 0.53% | 19 816.67 | - 673.89 | -3.40% |
| 28.02.2013 | 19 042.03 | 19 019.28 | 22.76 | 0.12% | 20 447.49 | -1 405.46 | -6.87% |
| 31.01.2013 | 19 019.28 | 19 169.47 | - 150.19 | -0.78% | 19 822.35 | - 803.08 | -4.05% |
| 31.12.2012 | 19 169.47 | 18 314.81 | 854.65 | 4.67% | 18 347.44 | 822.03 | 4.48% |
| 30.11.2012 | 18 314.81 | 18 281.48 | 33.33 | 0.18% | 18 445.14 | - 130.33 | -0.71% |
| 31.10.2012 | 18 281.48 | 18 633.91 | - 352.43 | -1.89% | 18 991.43 | - 709.94 | -3.74% |
| 30.09.2012 | 18 633.91 | 18 265.21 | 368.70 | 2.02% | 17 194.04 | 1 439.88 | 8.37% |
| 31.08.2012 | 18 265.21 | 18 050.23 | 214.98 | 1.19% | 18 732.81 | - 467.60 | -2.50% |
| 31.07.2012 | 18 050.23 | 17 709.04 | 341.19 | 1.93% | 21 268.53 | -3 218.30 | -15.13% |
| 30.06.2012 | 17 709.04 | 17 493.24 | 215.79 | 1.23% | 21 516.25 | -3 807.21 | -17.69% |
| 31.05.2012 | 17 493.24 | 19 693.95 | -2 200.70 | -11.17% | 22 048.19 | -4 554.95 | -20.66% |
| 30.04.2012 | 19 693.95 | 19 816.67 | - 122.72 | -0.62% | 22 355.93 | -2 661.98 | -11.91% |
| 31.03.2012 | 19 816.67 | 20 447.49 | - 630.82 | -3.08% | 22 174.56 | -2 357.89 | -10.63% |
| 29.02.2012 | 20 447.49 | 19 822.35 | 625.14 | 3.15% | 22 494.10 | -2 046.61 | -9.10% |
| 31.01.2012 | 19 822.35 | 18 347.44 | 1 474.91 | 8.04% | 21 950.32 | -2 127.96 | -9.69% |
| 31.12.2011 | 18 347.44 | 18 445.14 | -97.70 | -0.53% | 20 888.81 | -2 541.37 | -12.17% |
| 30.11.2011 | 18 445.14 | 18 991.43 | - 546.29 | -2.88% | 19 431.98 | - 986.84 | -5.08% |
| 31.10.2011 | 18 991.43 | 17 194.04 | 1 797.39 | 10.45% | 18 975.49 | 15.94 | 0.08% |
| 30.09.2011 | 17 194.04 | 18 732.81 | -1 538.77 | -8.21% | 18 339.62 | -1 145.59 | -6.25% |
| 31.08.2011 | 18 732.81 | 21 268.53 | -2 535.73 | -11.92% | 17 506.81 | 1 226.00 | 7.00% |
| 31.07.2011 | 21 268.53 | 21 516.25 | - 247.72 | -1.15% | 17 868.10 | 3 400.43 | 19.03% |
| 30.06.2011 | 21 516.25 | 22 048.19 | - 531.94 | -2.41% | 15 701.28 | 5 814.97 | 37.03% |
| 31.05.2011 | 22 048.19 | 22 355.93 | - 307.74 | -1.38% | 16 241.98 | 5 806.21 | 35.75% |
| 30.04.2011 | 22 355.93 | 22 174.56 | 181.37 | 0.82% | 17 856.44 | 4 499.49 | 25.20% |
| 31.03.2011 | 22 174.56 | 22 494.10 | - 319.54 | -1.42% | 17 762.47 | 4 412.09 | 24.84% |
| 28.02.2011 | 22 494.10 | 21 950.32 | 543.78 | 2.48% | 16 480.18 | 6 013.92 | 36.49% |
| 31.01.2011 | 21 950.32 | 20 888.81 | 1 061.51 | 5.08% | 16 544.02 | 5 406.30 | 32.68% |
| 31.12.2010 | 20 888.81 | 19 431.98 | 1 456.83 | 7.50% | 16 703.25 | 4 185.56 | 25.06% |
| 30.11.2010 | 19 431.98 | 18 975.49 | 456.50 | 2.41% | 15 930.52 | 3 501.46 | 21.98% |
| 31.10.2010 | 18 975.49 | 18 339.62 | 635.87 | 3.47% | 15 798.64 | 3 176.85 | 20.11% |
| 30.09.2010 | 18 339.62 | 17 506.81 | 832.82 | 4.76% | 15 528.06 | 2 811.56 | 18.11% |
| 31.08.2010 | 17 506.81 | 17 868.10 | - 361.29 | -2.02% | 14 713.78 | 2 793.03 | 18.98% |
| 31.07.2010 | 17 868.10 | 15 701.28 | 2 166.82 | 13.80% | 13 195.24 | 4 672.86 | 35.41% |
| 30.06.2010 | 15 701.28 | 16 241.98 | - 540.70 | -3.33% | 11 878.01 | 3 823.27 | 32.19% |
| 31.05.2010 | 16 241.98 | 17 856.44 | -1 614.46 | -9.04% | 11 976.51 | 4 265.47 | 35.62% |
| 30.04.2010 | 17 856.44 | 17 762.47 | 93.96 | 0.53% | 10 665.58 | 7 190.86 | 67.42% |
| 31.03.2010 | 17 762.47 | 16 480.18 | 1 282.29 | 7.78% | 9 195.01 | 8 567.47 | 93.18% |
| 28.02.2010 | 16 480.18 | 16 544.02 | -63.84 | -0.39% | 8 431.44 | 8 048.74 | 95.46% |
| 31.01.2010 | 16 544.02 | 16 703.25 | - 159.23 | -0.95% | 9 161.79 | 7 382.23 | 80.58% |
| 31.12.2009 | 16 703.25 | 15 930.52 | 772.72 | 4.85% | 9 368.47 | 7 334.78 | 78.29% |
| 30.11.2009 | 15 930.52 | 15 798.64 | 131.88 | 0.83% | 13 098.04 | 2 832.48 | 21.63% |
| 31.10.2009 | 15 798.64 | 15 528.06 | 270.58 | 1.74% | 13 098.04 | 2 700.60 | 20.62% |
| 30.09.2009 | 15 528.06 | 14 713.78 | 814.28 | 5.53% | 13 098.04 | 2 430.02 | 18.55% |
| 31.08.2009 | 14 713.78 | 13 195.24 | 1 518.54 | 11.51% | 15 560.78 | - 847.00 | -5.44% |
| 31.07.2009 | 13 195.24 | 11 878.01 | 1 317.22 | 11.09% | 15 560.78 | -2 365.55 | -15.20% |
| 30.06.2009 | 11 878.01 | 11 976.51 | -98.50 | -0.82% | 15 560.78 | -3 682.77 | -23.67% |
| 31.05.2009 | 11 976.51 | 10 665.58 | 1 310.93 | 12.29% | 15 809.92 | -3 833.41 | -24.25% |
| 30.04.2009 | 10 665.58 | 9 195.01 | 1 470.57 | 15.99% | 15 809.92 | -5 144.35 | -32.54% |
| 31.03.2009 | 9 195.01 | 8 431.44 | 763.56 | 9.06% | 15 809.92 | -6 614.92 | -41.84% |
| 28.02.2009 | 8 431.44 | 9 161.79 | - 730.35 | -7.97% | 18 743.62 | -10 312.17 | -55.02% |
| 31.01.2009 | 9 161.79 | 9 368.47 | - 206.67 | -2.21% | 18 743.62 | -9 581.83 | -51.12% |
| 31.12.2008 | 9 368.47 | 13 098.04 | -3 729.58 | -28.47% | 18 743.62 | -9 375.15 | -50.02% |
| 30.09.2008 | 13 098.04 | 15 560.78 | -2 462.74 | -15.83% | 18 310.73 | -5 212.69 | -28.47% |
| 30.06.2008 | 15 560.78 | 15 809.92 | - 249.14 | -1.58% | 16 174.48 | - 613.69 | -3.79% |
| 31.03.2008 | 15 809.92 | 18 743.62 | -2 933.69 | -15.65% | 13 737.75 | 2 072.17 | 15.08% |
| 31.12.2007 | 18 743.62 | 18 310.73 | 432.89 | 2.36% | 13 314.91 | 5 428.71 | 40.77% |
| 30.09.2007 | 18 310.73 | 16 174.48 | 2 136.25 | 13.21% | 12 424.40 | 5 886.33 | 47.38% |
| 30.06.2007 | 16 174.48 | 13 737.75 | 2 436.73 | 17.74% | 11 664.24 | 4 510.24 | 38.67% |
| 31.03.2007 | 13 737.75 | 13 314.91 | 422.84 | 3.18% | 11 233.84 | 2 503.92 | 22.29% |
| 31.12.2006 | 13 314.91 | 12 424.40 | 890.51 | 7.17% | 9 310.51 | 4 004.40 | 43.01% |
| 30.09.2006 | 12 424.40 | 11 664.24 | 760.16 | 6.52% | 8 419.36 | 4 005.04 | 47.57% |
| 30.06.2006 | 11 664.24 | 11 233.84 | 430.40 | 3.83% | 7 014.91 | 4 649.33 | 66.28% |
| 31.03.2006 | 11 233.84 | 9 310.51 | 1 923.33 | 20.66% | 5 881.67 | 5 352.16 | 91.00% |
| 31.12.2005 | 9 310.51 | 8 419.36 | 891.15 | 10.58% | 4 991.67 | 4 318.84 | 86.52% |
| 30.09.2005 | 8 419.36 | 7 014.91 | 1 404.45 | 20.02% | 4 736.96 | 3 682.40 | 77.74% |
| 30.06.2005 | 7 014.91 | 5 881.67 | 1 133.24 | 19.27% | - | - | - |
| 31.03.2005 | 5 881.67 | 4 991.67 | 890.00 | 17.83% | - | - | - |
| 31.12.2004 | 4 991.67 | 4 736.96 | 254.71 | 5.38% | - | - | - |
| 30.09.2004 | 4 736.96 | - | - | - | - | - | - |
Graf jako obrázek

Podobné sestavy
Aplikace Ekonomika ČNB ze sekce makroekonomika zobrazuje časové řady hlavních makroekonomických údajů z ekonomiky ČR. Najdete zde přes 10.000 grafů různých hodnot od úrokových sazeb, přes statistiky státního rozpočtu, statistiky ČNB a data zpracovávaná ČSÚ. Data jsou k dispozici obvykle za posledních více než 20 let, od prosince roku 1992. Zdroj dat: ČNB ARAD

