Investment fund shares/units (Equity Funds Balance Sheet - Flows) - ekonomika ČNB
Aktualizace dat Investment fund shares/units (Equity Funds Balance Sheet - Flows) v této aplikaci skončila 30.6.2023. Aktualizovná data časových řad najdete na stránkách nové aplikace z dat ARAD ČNB
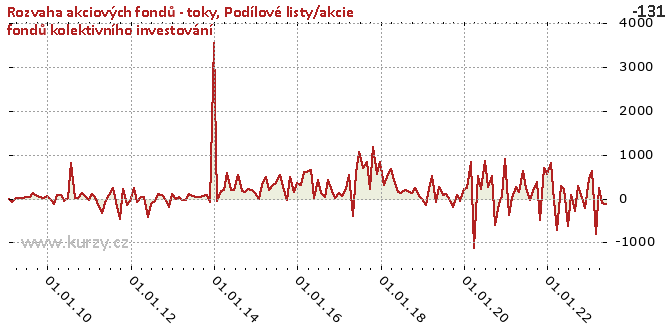
Graf hodnot, Equity Funds Balance Sheet - Flows
Meziroční srovnání
Minima a maxima
| Typ | Období | Hodnota |
|---|---|---|
| Min | 31.03.2020 | -1 136.14 |
| Max | 31.12.2013 | 3 549.47 |
Historické hodnoty
| Období | Hodnota | Předchozí | Rozdíl | Změna | Před rokem | Rozdíl | Změna |
|---|---|---|---|---|---|---|---|
| 30.06.2020 | 751.02 | 213.71 | 537.31 | 251.43% | 85.17 | 665.85 | 781.82% |
| 31.05.2020 | 213.71 | 515.25 | - 301.55 | -58.52% | 268.96 | -55.26 | -20.55% |
| 30.04.2020 | 515.25 | -1 136.14 | 1 651.39 | - 145.35% | -75.62 | 590.87 | - 781.41% |
| 31.03.2020 | -1 136.14 | 735.37 | -1 871.51 | - 254.50% | 502.79 | -1 638.92 | - 325.97% |
| 29.02.2020 | 735.37 | 277.34 | 458.04 | 165.15% | 225.78 | 509.59 | 225.70% |
| 31.01.2020 | 277.34 | 182.57 | 94.77 | 51.91% | - 144.98 | 422.31 | - 291.30% |
| 31.12.2019 | 182.57 | -67.03 | 249.61 | - 372.36% | -17.43 | 200.00 | -1 147.40% |
| 30.11.2019 | -67.03 | 77.77 | - 144.80 | - 186.20% | 49.51 | - 116.55 | - 235.39% |
| 31.10.2019 | 77.77 | - 202.90 | 280.67 | - 138.33% | 229.86 | - 152.09 | -66.17% |
| 30.09.2019 | - 202.90 | -28.97 | - 173.93 | 600.35% | 125.33 | - 328.23 | - 261.89% |
| 31.08.2019 | -28.97 | 104.93 | - 133.90 | - 127.61% | 163.61 | - 192.59 | - 117.71% |
| 31.07.2019 | 104.93 | 85.17 | 19.77 | 23.21% | 195.71 | -90.77 | -46.38% |
| 30.06.2019 | 85.17 | 268.96 | - 183.80 | -68.34% | 126.06 | -40.89 | -32.44% |
| 31.05.2019 | 268.96 | -75.62 | 344.58 | - 455.70% | 156.87 | 112.10 | 71.46% |
| 30.04.2019 | -75.62 | 502.79 | - 578.40 | - 115.04% | 418.69 | - 494.30 | - 118.06% |
| 31.03.2019 | 502.79 | 225.78 | 277.00 | 122.68% | 671.68 | - 168.90 | -25.15% |
| 28.02.2019 | 225.78 | - 144.98 | 370.76 | - 255.74% | 492.98 | - 267.19 | -54.20% |
| 31.01.2019 | - 144.98 | -17.43 | - 127.55 | 731.71% | 312.97 | - 457.94 | - 146.32% |
| 31.12.2018 | -17.43 | 49.51 | -66.94 | - 135.20% | 828.90 | - 846.33 | - 102.10% |
| 30.11.2018 | 49.51 | 229.86 | - 180.34 | -78.46% | 551.13 | - 501.62 | -91.02% |
| 31.10.2018 | 229.86 | 125.33 | 104.53 | 83.40% | 1 175.66 | - 945.80 | -80.45% |
| 30.09.2018 | 125.33 | 163.61 | -38.28 | -23.40% | 217.87 | -92.54 | -42.48% |
| 31.08.2018 | 163.61 | 195.71 | -32.09 | -16.40% | 834.59 | - 670.97 | -80.40% |
| 31.07.2018 | 195.71 | 126.06 | 69.65 | 55.25% | 700.43 | - 504.73 | -72.06% |
| 30.06.2018 | 126.06 | 156.87 | -30.81 | -19.64% | 1 068.89 | - 942.83 | -88.21% |
| 31.05.2018 | 156.87 | 418.69 | - 261.82 | -62.53% | 572.53 | - 415.66 | -72.60% |
| 30.04.2018 | 418.69 | 671.68 | - 253.00 | -37.67% | - 390.86 | 809.54 | - 207.12% |
| 31.03.2018 | 671.68 | 492.98 | 178.71 | 36.25% | 542.84 | 128.84 | 23.74% |
| 28.02.2018 | 492.98 | 312.97 | 180.01 | 57.52% | 214.89 | 278.09 | 129.41% |
| 31.01.2018 | 312.97 | 828.90 | - 515.93 | -62.24% | 63.65 | 249.32 | 391.73% |
| 31.12.2017 | 828.90 | 551.13 | 277.77 | 50.40% | 116.96 | 711.94 | 608.70% |
| 30.11.2017 | 551.13 | 1 175.66 | - 624.53 | -53.12% | 21.22 | 529.91 | 2 497.34% |
| 31.10.2017 | 1 175.66 | 217.87 | 957.79 | 439.61% | 170.40 | 1 005.26 | 589.93% |
| 30.09.2017 | 217.87 | 834.59 | - 616.71 | -73.89% | 409.96 | - 192.09 | -46.85% |
| 31.08.2017 | 834.59 | 700.43 | 134.15 | 19.15% | 40.51 | 794.08 | 1 960.10% |
| 31.07.2017 | 700.43 | 1 068.89 | - 368.46 | -34.47% | 124.04 | 576.39 | 464.66% |
| 30.06.2017 | 1 068.89 | 572.53 | 496.36 | 86.70% | 413.68 | 655.21 | 158.39% |
| 31.05.2017 | 572.53 | - 390.86 | 963.38 | - 246.48% | 18.05 | 554.48 | 3 072.59% |
| 30.04.2017 | - 390.86 | 542.84 | - 933.70 | - 172.00% | 639.78 | -1 030.64 | - 161.09% |
| 31.03.2017 | 542.84 | 214.89 | 327.95 | 152.61% | 594.76 | -51.92 | -8.73% |
| 28.02.2017 | 214.89 | 63.65 | 151.24 | 237.63% | 599.01 | - 384.13 | -64.13% |
| 31.01.2017 | 63.65 | 116.96 | -53.31 | -45.58% | 300.18 | - 236.54 | -78.80% |
| 31.12.2016 | 116.96 | 21.22 | 95.74 | 451.21% | 357.62 | - 240.66 | -67.29% |
| 30.11.2016 | 21.22 | 170.40 | - 149.19 | -87.55% | 146.90 | - 125.69 | -85.56% |
| 31.10.2016 | 170.40 | 409.96 | - 239.56 | -58.43% | 494.25 | - 323.85 | -65.52% |
| 30.09.2016 | 409.96 | 40.51 | 369.45 | 911.95% | -22.69 | 432.65 | -1 907.11% |
| 31.08.2016 | 40.51 | 124.04 | -83.53 | -67.34% | 260.43 | - 219.92 | -84.44% |
| 31.07.2016 | 124.04 | 413.68 | - 289.63 | -70.01% | 530.71 | - 406.67 | -76.63% |
| 30.06.2016 | 413.68 | 18.05 | 395.63 | 2 192.35% | 343.16 | 70.52 | 20.55% |
| 31.05.2016 | 18.05 | 639.78 | - 621.73 | -97.18% | 311.53 | - 293.48 | -94.21% |
| 30.04.2016 | 639.78 | 594.76 | 45.02 | 7.57% | 186.86 | 452.92 | 242.38% |
| 31.03.2016 | 594.76 | 599.01 | -4.26 | -0.71% | 492.39 | 102.37 | 20.79% |
| 29.02.2016 | 599.01 | 300.18 | 298.83 | 99.55% | 317.98 | 281.03 | 88.38% |
| 31.01.2016 | 300.18 | 357.62 | -57.44 | -16.06% | -14.39 | 314.58 | -2 185.32% |
| 31.12.2015 | 357.62 | 146.90 | 210.72 | 143.44% | 131.10 | 226.52 | 172.79% |
| 30.11.2015 | 146.90 | 494.25 | - 347.35 | -70.28% | 194.60 | -47.70 | -24.51% |
| 31.10.2015 | 494.25 | -22.69 | 516.94 | -2 278.66% | 206.72 | 287.54 | 139.10% |
| 30.09.2015 | -22.69 | 260.43 | - 283.12 | - 108.71% | 145.47 | - 168.16 | - 115.59% |
| 31.08.2015 | 260.43 | 530.71 | - 270.28 | -50.93% | 169.70 | 90.73 | 53.47% |
| 31.07.2015 | 530.71 | 343.16 | 187.55 | 54.65% | 535.77 | -5.07 | -0.95% |
| 30.06.2015 | 343.16 | 311.53 | 31.63 | 10.15% | 183.92 | 159.24 | 86.58% |
| 31.05.2015 | 311.53 | 186.86 | 124.67 | 66.72% | 185.46 | 126.06 | 67.97% |
| 30.04.2015 | 186.86 | 492.39 | - 305.53 | -62.05% | 590.71 | - 403.85 | -68.37% |
| 31.03.2015 | 492.39 | 317.98 | 174.41 | 54.85% | 198.59 | 293.80 | 147.95% |
| 28.02.2015 | 317.98 | -14.39 | 332.38 | -2 308.97% | 160.76 | 157.22 | 97.80% |
| 31.01.2015 | -14.39 | 131.10 | - 145.50 | - 110.98% | -47.56 | 33.16 | -69.73% |
| 31.12.2014 | 131.10 | 194.60 | -63.50 | -32.63% | 3 549.47 | -3 418.37 | -96.31% |
| 30.11.2014 | 194.60 | 206.72 | -12.12 | -5.86% | -76.14 | 270.74 | - 355.59% |
| 31.10.2014 | 206.72 | 145.47 | 61.24 | 42.10% | 71.91 | 134.80 | 187.46% |
| 30.09.2014 | 145.47 | 169.70 | -24.22 | -14.27% | 62.50 | 82.97 | 132.75% |
| 31.08.2014 | 169.70 | 535.77 | - 366.08 | -68.33% | 34.69 | 135.00 | 389.15% |
| 31.07.2014 | 535.77 | 183.92 | 351.86 | 191.31% | 36.98 | 498.80 | 1 348.98% |
| 30.06.2014 | 183.92 | 185.46 | -1.55 | -0.83% | 63.84 | 120.08 | 188.11% |
| 31.05.2014 | 185.46 | 590.71 | - 405.25 | -68.60% | 104.39 | 81.08 | 77.67% |
| 30.04.2014 | 590.71 | 198.59 | 392.12 | 197.46% | -40.81 | 631.52 | -1 547.47% |
| 31.03.2014 | 198.59 | 160.76 | 37.83 | 23.53% | -23.82 | 222.41 | - 933.66% |
| 28.02.2014 | 160.76 | -47.56 | 208.32 | - 438.02% | 26.18 | 134.58 | 514.13% |
| 31.01.2014 | -47.56 | 3 549.47 | -3 597.03 | - 101.34% | -1.98 | -45.58 | 2 297.13% |
| 31.12.2013 | 3 549.47 | -76.14 | 3 625.60 | -4 761.88% | 103.49 | 3 445.97 | 3 329.67% |
| 30.11.2013 | -76.14 | 71.91 | - 148.05 | - 205.88% | - 202.66 | 126.52 | -62.43% |
| 31.10.2013 | 71.91 | 62.50 | 9.41 | 15.05% | -13.78 | 85.69 | - 621.74% |
| 30.09.2013 | 62.50 | 34.69 | 27.81 | 80.17% | 74.82 | -12.32 | -16.47% |
| 31.08.2013 | 34.69 | 36.98 | -2.28 | -6.18% | 101.09 | -66.40 | -65.68% |
| 31.07.2013 | 36.98 | 63.84 | -26.86 | -42.08% | -54.67 | 91.64 | - 167.64% |
| 30.06.2013 | 63.84 | 104.39 | -40.55 | -38.85% | - 117.91 | 181.75 | - 154.14% |
| 31.05.2013 | 104.39 | -40.81 | 145.20 | - 355.79% | - 427.39 | 531.78 | - 124.42% |
| 30.04.2013 | -40.81 | -23.82 | -16.99 | 71.32% | 32.08 | -72.89 | - 227.23% |
| 31.03.2013 | -23.82 | 26.18 | -50.00 | - 191.00% | 33.74 | -57.56 | - 170.61% |
| 28.02.2013 | 26.18 | -1.98 | 28.16 | -1 419.41% | -86.37 | 112.55 | - 130.31% |
| 31.01.2013 | -1.98 | 103.49 | - 105.48 | - 101.92% | 233.47 | - 235.46 | - 100.85% |
| 31.12.2012 | 103.49 | - 202.66 | 306.15 | - 151.07% | -66.04 | 169.53 | - 256.72% |
| 30.11.2012 | - 202.66 | -13.78 | - 188.88 | 1 370.38% | - 147.51 | -55.15 | 37.39% |
| 31.10.2012 | -13.78 | 74.82 | -88.61 | - 118.42% | 220.80 | - 234.59 | - 106.24% |
| 30.09.2012 | 74.82 | 101.09 | -26.27 | -25.99% | - 461.27 | 536.10 | - 116.22% |
| 31.08.2012 | 101.09 | -54.67 | 155.76 | - 284.93% | -74.21 | 175.31 | - 236.22% |
| 31.07.2012 | -54.67 | - 117.91 | 63.24 | -53.64% | 240.25 | - 294.91 | - 122.75% |
| 30.06.2012 | - 117.91 | - 427.39 | 309.48 | -72.41% | 74.35 | - 192.26 | - 258.59% |
| 31.05.2012 | - 427.39 | 32.08 | - 459.46 | -1 432.38% | -22.67 | - 404.72 | 1 785.42% |
| 30.04.2012 | 32.08 | 33.74 | -1.66 | -4.92% | - 337.69 | 369.76 | - 109.50% |
| 31.03.2012 | 33.74 | -86.37 | 120.11 | - 139.06% | - 203.06 | 236.79 | - 116.61% |
| 29.02.2012 | -86.37 | 233.47 | - 319.85 | - 137.00% | 28.23 | - 114.60 | - 405.97% |
| 31.01.2012 | 233.47 | -66.04 | 299.51 | - 453.55% | 98.72 | 134.75 | 136.51% |
| 31.12.2011 | -66.04 | - 147.51 | 81.47 | -55.23% | -29.34 | -36.70 | 125.09% |
| 30.11.2011 | - 147.51 | 220.80 | - 368.31 | - 166.80% | 56.40 | - 203.90 | - 361.56% |
| 31.10.2011 | 220.80 | - 461.27 | 682.08 | - 147.87% | 126.30 | 94.50 | 74.82% |
| 30.09.2011 | - 461.27 | -74.21 | - 387.06 | 521.56% | 15.31 | - 476.58 | -3 113.47% |
| 31.08.2011 | -74.21 | 240.25 | - 314.46 | - 130.89% | 9.44 | -83.65 | - 886.48% |
| 31.07.2011 | 240.25 | 74.35 | 165.90 | 223.14% | 798.12 | - 557.87 | -69.90% |
| 30.06.2011 | 74.35 | -22.67 | 97.02 | - 427.99% | 21.64 | 52.70 | 243.50% |
| 31.05.2011 | -22.67 | - 337.69 | 315.02 | -93.29% | -49.90 | 27.23 | -54.57% |
| 30.04.2011 | - 337.69 | - 203.06 | - 134.63 | 66.30% | 72.25 | - 409.93 | - 567.42% |
| 31.03.2011 | - 203.06 | 28.23 | - 231.29 | - 819.29% | 75.38 | - 278.43 | - 369.39% |
| 28.02.2011 | 28.23 | 98.72 | -70.49 | -71.40% | - 125.33 | 153.56 | - 122.53% |
| 31.01.2011 | 98.72 | -29.34 | 128.06 | - 436.48% | -30.36 | 129.08 | - 425.11% |
| 31.12.2010 | -29.34 | 56.40 | -85.73 | - 152.02% | 60.37 | -89.71 | - 148.60% |
| 30.11.2010 | 56.40 | 126.30 | -69.91 | -55.35% | 20.91 | 35.48 | 169.69% |
| 31.10.2010 | 126.30 | 15.31 | 111.00 | 725.13% | 36.81 | 89.49 | 243.12% |
| 30.09.2010 | 15.31 | 9.44 | 5.87 | 62.22% | 66.64 | -51.34 | -77.03% |
| 31.08.2010 | 9.44 | 798.12 | - 788.68 | -98.82% | 114.55 | - 105.12 | -91.76% |
| 31.07.2010 | 798.12 | 21.64 | 776.47 | 3 587.48% | 39.90 | 758.22 | 1 900.20% |
| 30.06.2010 | 21.64 | -49.90 | 71.55 | - 143.37% | 29.12 | -7.47 | -25.66% |
| 31.05.2010 | -49.90 | 72.25 | - 122.15 | - 169.07% | 6.19 | -56.09 | - 906.42% |
| 30.04.2010 | 72.25 | 75.38 | -3.13 | -4.15% | 18.82 | 53.42 | 283.81% |
| 31.03.2010 | 75.38 | - 125.33 | 200.70 | - 160.14% | 20.96 | 54.41 | 259.57% |
| 28.02.2010 | - 125.33 | -30.36 | -94.96 | 312.75% | -75.74 | -49.59 | 65.48% |
| 31.01.2010 | -30.36 | 60.37 | -90.73 | - 150.30% | -4.53 | -25.83 | 569.70% |
| 31.12.2009 | 60.37 | 20.91 | 39.46 | 188.70% | - | - | - |
| 30.11.2009 | 20.91 | 36.81 | -15.90 | -43.19% | - | - | - |
| 31.10.2009 | 36.81 | 66.64 | -29.84 | -44.77% | - | - | - |
| 30.09.2009 | 66.64 | 114.55 | -47.91 | -41.82% | - | - | - |
| 31.08.2009 | 114.55 | 39.90 | 74.65 | 187.09% | - | - | - |
| 31.07.2009 | 39.90 | 29.12 | 10.79 | 37.04% | - | - | - |
| 30.06.2009 | 29.12 | 6.19 | 22.93 | 370.52% | - | - | - |
| 31.05.2009 | 6.19 | 18.82 | -12.63 | -67.13% | - | - | - |
| 30.04.2009 | 18.82 | 20.96 | -2.14 | -10.21% | - | - | - |
| 31.03.2009 | 20.96 | -75.74 | 96.70 | - 127.68% | - | - | - |
| 28.02.2009 | -75.74 | -4.53 | -71.20 | 1 570.40% | - | - | - |
| 31.01.2009 | -4.53 | - | - | - | - | - | - |
Graf jako obrázek

Podobné sestavy
Aplikace Ekonomika ČNB ze sekce makroekonomika zobrazuje časové řady hlavních makroekonomických údajů z ekonomiky ČR. Najdete zde přes 10.000 grafů různých hodnot od úrokových sazeb, přes statistiky státního rozpočtu, statistiky ČNB a data zpracovávaná ČSÚ. Data jsou k dispozici obvykle za posledních více než 20 let, od prosince roku 1992. Zdroj dat: ČNB ARAD

