Mutual funds shares/units issued (Equity Funds Balance Sheet - Flows) - ekonomika ČNB
Aktualizace dat Mutual funds shares/units issued (Equity Funds Balance Sheet - Flows) v této aplikaci skončila 30.6.2023. Aktualizovná data časových řad najdete na stránkách nové aplikace z dat ARAD ČNB
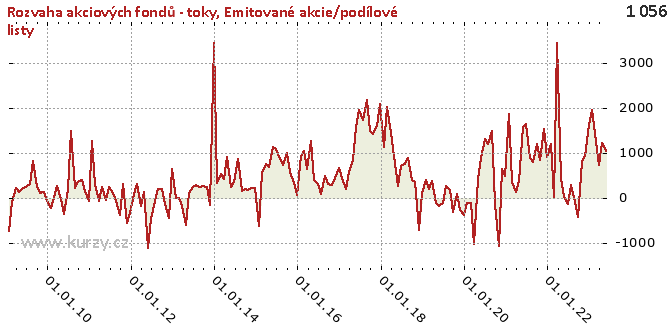
Graf hodnot, Equity Funds Balance Sheet - Flows
Meziroční srovnání
Minima a maxima
| Typ | Období | Hodnota |
|---|---|---|
| Max | 31.12.2013 | 3 450.80 |
| Min | 31.05.2012 | -1 111.02 |
Historické hodnoty
| Období | Hodnota | Předchozí | Rozdíl | Změna | Před rokem | Rozdíl | Změna |
|---|---|---|---|---|---|---|---|
| 30.06.2020 | 1 361.49 | 898.66 | 462.83 | 51.50% | - 111.39 | 1 472.89 | -1 322.23% |
| 31.05.2020 | 898.66 | 402.66 | 496.00 | 123.18% | - 178.90 | 1 077.56 | - 602.32% |
| 30.04.2020 | 402.66 | -1 025.73 | 1 428.39 | - 139.26% | - 109.94 | 512.61 | - 466.24% |
| 31.03.2020 | -1 025.73 | - 123.61 | - 902.12 | 729.81% | 374.24 | -1 399.97 | - 374.08% |
| 29.02.2020 | - 123.61 | -82.28 | -41.33 | 50.23% | 197.67 | - 321.28 | - 162.53% |
| 31.01.2020 | -82.28 | - 311.96 | 229.68 | -73.62% | 412.65 | - 494.93 | - 119.94% |
| 31.12.2019 | - 311.96 | - 261.74 | -50.22 | 19.19% | 126.53 | - 438.50 | - 346.54% |
| 30.11.2019 | - 261.74 | 102.64 | - 364.39 | - 355.01% | - 703.42 | 441.68 | -62.79% |
| 31.10.2019 | 102.64 | - 294.86 | 397.50 | - 134.81% | 361.89 | - 259.25 | -71.64% |
| 30.09.2019 | - 294.86 | 185.43 | - 480.29 | - 259.01% | 404.65 | - 699.51 | - 172.87% |
| 31.08.2019 | 185.43 | 270.75 | -85.32 | -31.51% | 883.80 | - 698.37 | -79.02% |
| 31.07.2019 | 270.75 | - 111.39 | 382.15 | - 343.06% | 753.57 | - 482.82 | -64.07% |
| 30.06.2019 | - 111.39 | - 178.90 | 67.51 | -37.73% | 714.76 | - 826.15 | - 115.58% |
| 31.05.2019 | - 178.90 | - 109.94 | -68.96 | 62.72% | 279.12 | - 458.02 | - 164.10% |
| 30.04.2019 | - 109.94 | 374.24 | - 484.19 | - 129.38% | 926.72 | -1 036.66 | - 111.86% |
| 31.03.2019 | 374.24 | 197.67 | 176.57 | 89.32% | 1 448.22 | -1 073.98 | -74.16% |
| 28.02.2019 | 197.67 | 412.65 | - 214.97 | -52.10% | 2 020.58 | -1 822.91 | -90.22% |
| 31.01.2019 | 412.65 | 126.53 | 286.11 | 226.11% | 1 145.50 | - 732.85 | -63.98% |
| 31.12.2018 | 126.53 | - 703.42 | 829.96 | - 117.99% | 2 096.80 | -1 970.27 | -93.97% |
| 30.11.2018 | - 703.42 | 361.89 | -1 065.31 | - 294.38% | 1 610.98 | -2 314.41 | - 143.66% |
| 31.10.2018 | 361.89 | 404.65 | -42.76 | -10.57% | 1 430.75 | -1 068.86 | -74.71% |
| 30.09.2018 | 404.65 | 883.80 | - 479.15 | -54.21% | 1 480.93 | -1 076.28 | -72.68% |
| 31.08.2018 | 883.80 | 753.57 | 130.23 | 17.28% | 2 171.17 | -1 287.37 | -59.29% |
| 31.07.2018 | 753.57 | 714.76 | 38.82 | 5.43% | 1 739.27 | - 985.70 | -56.67% |
| 30.06.2018 | 714.76 | 279.12 | 435.64 | 156.08% | 1 952.83 | -1 238.08 | -63.40% |
| 31.05.2018 | 279.12 | 926.72 | - 647.60 | -69.88% | 1 583.21 | -1 304.09 | -82.37% |
| 30.04.2018 | 926.72 | 1 448.22 | - 521.50 | -36.01% | 846.83 | 79.89 | 9.43% |
| 31.03.2018 | 1 448.22 | 2 020.58 | - 572.36 | -28.33% | 579.64 | 868.58 | 149.85% |
| 28.02.2018 | 2 020.58 | 1 145.50 | 875.09 | 76.39% | 198.87 | 1 821.72 | 916.06% |
| 31.01.2018 | 1 145.50 | 2 096.80 | - 951.31 | -45.37% | 455.31 | 690.19 | 151.59% |
| 31.12.2017 | 2 096.80 | 1 610.98 | 485.82 | 30.16% | 676.17 | 1 420.64 | 210.10% |
| 30.11.2017 | 1 610.98 | 1 430.75 | 180.23 | 12.60% | 451.94 | 1 159.04 | 256.45% |
| 31.10.2017 | 1 430.75 | 1 480.93 | -50.18 | -3.39% | 290.23 | 1 140.52 | 392.97% |
| 30.09.2017 | 1 480.93 | 2 171.17 | - 690.24 | -31.79% | 323.13 | 1 157.81 | 358.31% |
| 31.08.2017 | 2 171.17 | 1 739.27 | 431.90 | 24.83% | 490.31 | 1 680.86 | 342.82% |
| 31.07.2017 | 1 739.27 | 1 952.83 | - 213.56 | -10.94% | 99.49 | 1 639.78 | 1 648.12% |
| 30.06.2017 | 1 952.83 | 1 583.21 | 369.62 | 23.35% | 316.07 | 1 636.76 | 517.85% |
| 31.05.2017 | 1 583.21 | 846.83 | 736.38 | 86.96% | 413.76 | 1 169.45 | 282.64% |
| 30.04.2017 | 846.83 | 579.64 | 267.19 | 46.10% | 1 272.26 | - 425.43 | -33.44% |
| 31.03.2017 | 579.64 | 198.87 | 380.77 | 191.47% | 640.70 | -61.06 | -9.53% |
| 28.02.2017 | 198.87 | 455.31 | - 256.44 | -56.32% | 1 040.45 | - 841.58 | -80.89% |
| 31.01.2017 | 455.31 | 676.17 | - 220.86 | -32.66% | 926.81 | - 471.51 | -50.87% |
| 31.12.2016 | 676.17 | 451.94 | 224.22 | 49.61% | 75.88 | 600.28 | 791.05% |
| 30.11.2016 | 451.94 | 290.23 | 161.71 | 55.72% | 346.19 | 105.75 | 30.55% |
| 31.10.2016 | 290.23 | 323.13 | -32.90 | -10.18% | 584.66 | - 294.43 | -50.36% |
| 30.09.2016 | 323.13 | 490.31 | - 167.18 | -34.10% | 1 010.45 | - 687.33 | -68.02% |
| 31.08.2016 | 490.31 | 99.49 | 390.82 | 392.80% | 740.91 | - 250.60 | -33.82% |
| 31.07.2016 | 99.49 | 316.07 | - 216.58 | -68.52% | 874.64 | - 775.15 | -88.62% |
| 30.06.2016 | 316.07 | 413.76 | -97.69 | -23.61% | 1 101.09 | - 785.02 | -71.29% |
| 31.05.2016 | 413.76 | 1 272.26 | - 858.50 | -67.48% | 1 137.46 | - 723.70 | -63.62% |
| 30.04.2016 | 1 272.26 | 640.70 | 631.55 | 98.57% | 697.13 | 575.13 | 82.50% |
| 31.03.2016 | 640.70 | 1 040.45 | - 399.75 | -38.42% | 763.52 | - 122.82 | -16.09% |
| 29.02.2016 | 1 040.45 | 926.81 | 113.64 | 12.26% | 569.58 | 470.87 | 82.67% |
| 31.01.2016 | 926.81 | 75.88 | 850.93 | 1 121.36% | - 604.45 | 1 531.26 | - 253.33% |
| 31.12.2015 | 75.88 | 346.19 | - 270.31 | -78.08% | 229.02 | - 153.14 | -66.87% |
| 30.11.2015 | 346.19 | 584.66 | - 238.47 | -40.79% | 232.69 | 113.50 | 48.78% |
| 31.10.2015 | 584.66 | 1 010.45 | - 425.79 | -42.14% | 174.80 | 409.87 | 234.48% |
| 30.09.2015 | 1 010.45 | 740.91 | 269.54 | 36.38% | 210.98 | 799.47 | 378.93% |
| 31.08.2015 | 740.91 | 874.64 | - 133.74 | -15.29% | 156.39 | 584.52 | 373.76% |
| 31.07.2015 | 874.64 | 1 101.09 | - 226.45 | -20.57% | 879.50 | -4.86 | -0.55% |
| 30.06.2015 | 1 101.09 | 1 137.46 | -36.37 | -3.20% | 351.42 | 749.67 | 213.33% |
| 31.05.2015 | 1 137.46 | 697.13 | 440.33 | 63.16% | 241.21 | 896.25 | 371.56% |
| 30.04.2015 | 697.13 | 763.52 | -66.39 | -8.70% | 913.79 | - 216.67 | -23.71% |
| 31.03.2015 | 763.52 | 569.58 | 193.94 | 34.05% | 419.89 | 343.63 | 81.84% |
| 28.02.2015 | 569.58 | - 604.45 | 1 174.03 | - 194.23% | 541.68 | 27.91 | 5.15% |
| 31.01.2015 | - 604.45 | 229.02 | - 833.47 | - 363.93% | 347.74 | - 952.19 | - 273.82% |
| 31.12.2014 | 229.02 | 232.69 | -3.67 | -1.58% | 3 450.80 | -3 221.78 | -93.36% |
| 30.11.2014 | 232.69 | 174.80 | 57.90 | 33.12% | - 154.19 | 386.88 | - 250.91% |
| 31.10.2014 | 174.80 | 210.98 | -36.19 | -17.15% | 253.82 | -79.03 | -31.13% |
| 30.09.2014 | 210.98 | 156.39 | 54.59 | 34.91% | 263.31 | -52.33 | -19.87% |
| 31.08.2014 | 156.39 | 879.50 | - 723.11 | -82.22% | 258.79 | - 102.40 | -39.57% |
| 31.07.2014 | 879.50 | 351.42 | 528.08 | 150.27% | 298.71 | 580.79 | 194.43% |
| 30.06.2014 | 351.42 | 241.21 | 110.21 | 45.69% | 246.26 | 105.16 | 42.70% |
| 31.05.2014 | 241.21 | 913.79 | - 672.58 | -73.60% | 126.58 | 114.63 | 90.55% |
| 30.04.2014 | 913.79 | 419.89 | 493.91 | 117.63% | - 592.12 | 1 505.91 | - 254.33% |
| 31.03.2014 | 419.89 | 541.68 | - 121.79 | -22.48% | - 177.34 | 597.23 | - 336.77% |
| 28.02.2014 | 541.68 | 347.74 | 193.94 | 55.77% | -1.58 | 543.25 | -34 426.81% |
| 31.01.2014 | 347.74 | 3 450.80 | -3 103.06 | -89.92% | 17.40 | 330.34 | 1 898.86% |
| 31.12.2013 | 3 450.80 | - 154.19 | 3 604.99 | -2 338.03% | 641.05 | 2 809.75 | 438.30% |
| 30.11.2013 | - 154.19 | 253.82 | - 408.01 | - 160.75% | - 431.25 | 277.06 | -64.25% |
| 31.10.2013 | 253.82 | 263.31 | -9.49 | -3.60% | - 137.61 | 391.43 | - 284.45% |
| 30.09.2013 | 263.31 | 258.79 | 4.52 | 1.75% | 197.41 | 65.91 | 33.38% |
| 31.08.2013 | 258.79 | 298.71 | -39.92 | -13.36% | 211.06 | 47.73 | 22.61% |
| 31.07.2013 | 298.71 | 246.26 | 52.45 | 21.30% | -52.57 | 351.28 | - 668.25% |
| 30.06.2013 | 246.26 | 126.58 | 119.67 | 94.54% | - 460.26 | 706.52 | - 153.50% |
| 31.05.2013 | 126.58 | - 592.12 | 718.70 | - 121.38% | -1 111.02 | 1 237.60 | - 111.39% |
| 30.04.2013 | - 592.12 | - 177.34 | - 414.78 | 233.89% | 129.50 | - 721.61 | - 557.25% |
| 31.03.2013 | - 177.34 | -1.58 | - 175.76 | 11 138.09% | - 174.33 | -3.00 | 1.72% |
| 28.02.2013 | -1.58 | 17.40 | -18.98 | - 109.07% | 317.80 | - 319.38 | - 100.50% |
| 31.01.2013 | 17.40 | 641.05 | - 623.66 | -97.29% | 105.36 | -87.97 | -83.49% |
| 31.12.2012 | 641.05 | - 431.25 | 1 072.30 | - 248.65% | - 326.03 | 967.08 | - 296.63% |
| 30.11.2012 | - 431.25 | - 137.61 | - 293.63 | 213.38% | - 544.71 | 113.47 | -20.83% |
| 31.10.2012 | - 137.61 | 197.41 | - 335.02 | - 169.71% | 307.70 | - 445.31 | - 144.72% |
| 30.09.2012 | 197.41 | 211.06 | -13.65 | -6.47% | - 378.23 | 575.63 | - 152.19% |
| 31.08.2012 | 211.06 | -52.57 | 263.63 | - 501.51% | -57.99 | 269.06 | - 463.93% |
| 31.07.2012 | -52.57 | - 460.26 | 407.69 | -88.58% | 111.05 | - 163.62 | - 147.34% |
| 30.06.2012 | - 460.26 | -1 111.02 | 650.76 | -58.57% | 249.32 | - 709.58 | - 284.60% |
| 31.05.2012 | -1 111.02 | 129.50 | -1 240.51 | - 957.96% | -43.76 | -1 067.26 | 2 439.12% |
| 30.04.2012 | 129.50 | - 174.33 | 303.83 | - 174.28% | 258.83 | - 129.34 | -49.97% |
| 31.03.2012 | - 174.33 | 317.80 | - 492.13 | - 154.86% | -56.96 | - 117.38 | 206.08% |
| 29.02.2012 | 317.80 | 105.36 | 212.44 | 201.63% | 300.57 | 17.23 | 5.73% |
| 31.01.2012 | 105.36 | - 326.03 | 431.39 | - 132.32% | 1 268.24 | -1 162.88 | -91.69% |
| 31.12.2011 | - 326.03 | - 544.71 | 218.69 | -40.15% | -58.16 | - 267.87 | 460.59% |
| 30.11.2011 | - 544.71 | 307.70 | - 852.41 | - 277.03% | 151.01 | - 695.72 | - 460.71% |
| 31.10.2011 | 307.70 | - 378.23 | 685.92 | - 181.35% | 398.63 | -90.93 | -22.81% |
| 30.09.2011 | - 378.23 | -57.99 | - 320.23 | 552.17% | 352.28 | - 730.50 | - 207.37% |
| 31.08.2011 | -57.99 | 111.05 | - 169.05 | - 152.22% | 218.87 | - 276.87 | - 126.50% |
| 31.07.2011 | 111.05 | 249.32 | - 138.27 | -55.46% | 1 489.76 | -1 378.71 | -92.55% |
| 30.06.2011 | 249.32 | -43.76 | 293.08 | - 669.81% | 203.73 | 45.59 | 22.38% |
| 31.05.2011 | -43.76 | 258.83 | - 302.59 | - 116.91% | - 358.45 | 314.70 | -87.79% |
| 30.04.2011 | 258.83 | -56.96 | 315.79 | - 554.44% | -10.64 | 269.47 | -2 532.64% |
| 31.03.2011 | -56.96 | 300.57 | - 357.53 | - 118.95% | 281.92 | - 338.88 | - 120.20% |
| 28.02.2011 | 300.57 | 1 268.24 | - 967.67 | -76.30% | -1.12 | 301.69 | -26 984.62% |
| 31.01.2011 | 1 268.24 | -58.16 | 1 326.40 | -2 280.69% | - 216.65 | 1 484.89 | - 685.39% |
| 31.12.2010 | -58.16 | 151.01 | - 209.17 | - 138.51% | -60.67 | 2.51 | -4.14% |
| 30.11.2010 | 151.01 | 398.63 | - 247.62 | -62.12% | 135.59 | 15.43 | 11.38% |
| 31.10.2010 | 398.63 | 352.28 | 46.35 | 13.16% | 120.56 | 278.07 | 230.65% |
| 30.09.2010 | 352.28 | 218.87 | 133.41 | 60.95% | 244.69 | 107.59 | 43.97% |
| 31.08.2010 | 218.87 | 1 489.76 | -1 270.89 | -85.31% | 830.31 | - 611.44 | -73.64% |
| 31.07.2010 | 1 489.76 | 203.73 | 1 286.03 | 631.23% | 326.86 | 1 162.90 | 355.78% |
| 30.06.2010 | 203.73 | - 358.45 | 562.18 | - 156.84% | 260.38 | -56.65 | -21.76% |
| 31.05.2010 | - 358.45 | -10.64 | - 347.81 | 3 268.91% | 239.04 | - 597.50 | - 249.95% |
| 30.04.2010 | -10.64 | 281.92 | - 292.56 | - 103.77% | 133.78 | - 144.41 | - 107.95% |
| 31.03.2010 | 281.92 | -1.12 | 283.04 | -25 316.73% | 235.39 | 46.53 | 19.77% |
| 28.02.2010 | -1.12 | - 216.65 | 215.53 | -99.48% | -76.32 | 75.20 | -98.53% |
| 31.01.2010 | - 216.65 | -60.67 | - 155.98 | 257.11% | - 727.65 | 511.00 | -70.23% |
| 31.12.2009 | -60.67 | 135.59 | - 196.25 | - 144.74% | - | - | - |
| 30.11.2009 | 135.59 | 120.56 | 15.03 | 12.46% | - | - | - |
| 31.10.2009 | 120.56 | 244.69 | - 124.13 | -50.73% | - | - | - |
| 30.09.2009 | 244.69 | 830.31 | - 585.62 | -70.53% | - | - | - |
| 31.08.2009 | 830.31 | 326.86 | 503.45 | 154.03% | - | - | - |
| 31.07.2009 | 326.86 | 260.38 | 66.48 | 25.53% | - | - | - |
| 30.06.2009 | 260.38 | 239.04 | 21.34 | 8.93% | - | - | - |
| 31.05.2009 | 239.04 | 133.78 | 105.27 | 78.69% | - | - | - |
| 30.04.2009 | 133.78 | 235.39 | - 101.61 | -43.17% | - | - | - |
| 31.03.2009 | 235.39 | -76.32 | 311.71 | - 408.44% | - | - | - |
| 28.02.2009 | -76.32 | - 727.65 | 651.34 | -89.51% | - | - | - |
| 31.01.2009 | - 727.65 | - | - | - | - | - | - |
Graf jako obrázek

Podobné sestavy
Aplikace Ekonomika ČNB ze sekce makroekonomika zobrazuje časové řady hlavních makroekonomických údajů z ekonomiky ČR. Najdete zde přes 10.000 grafů různých hodnot od úrokových sazeb, přes statistiky státního rozpočtu, statistiky ČNB a data zpracovávaná ČSÚ. Data jsou k dispozici obvykle za posledních více než 20 let, od prosince roku 1992. Zdroj dat: ČNB ARAD

