Unlisted shares (AF.512) (Financial assets, stocks, Households) - ekonomika ČNB
Aktualizace dat Unlisted shares (AF.512) (Financial assets, stocks, Households) v této aplikaci skončila 30.6.2023. Aktualizovná data časových řad najdete na stránkách nové aplikace z dat ARAD ČNB
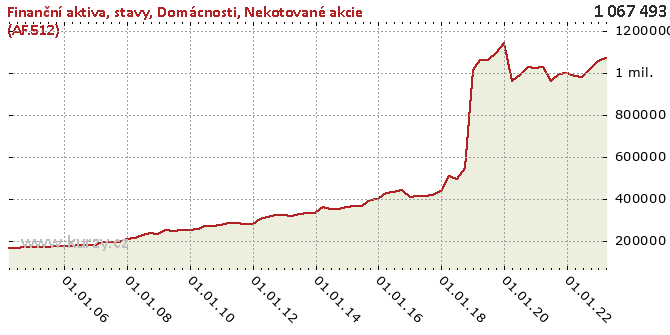
Graf hodnot, Financial assets, stocks, Households
Meziroční srovnání
Minima a maxima
| Typ | Období | Hodnota |
|---|---|---|
| Max | 31.03.2020 | 1 215 208.00 |
| Min | 31.03.2004 | 162 677.00 |
Historické hodnoty
| Období | Hodnota | Předchozí | Rozdíl | Změna | Před rokem | Rozdíl | Změna |
|---|---|---|---|---|---|---|---|
| 31.03.2020 | 1 215 208.00 | 1 156 990.00 | 58 218.00 | 5.03% | 1 059 199.00 | 156 009.00 | 14.73% |
| 31.12.2019 | 1 156 990.00 | 1 093 975.00 | 63 015.00 | 5.76% | 1 010 344.00 | 146 646.00 | 14.51% |
| 30.09.2019 | 1 093 975.00 | 1 061 815.00 | 32 160.00 | 3.03% | 544 520.00 | 549 455.00 | 100.91% |
| 30.06.2019 | 1 061 815.00 | 1 059 199.00 | 2 616.00 | 0.25% | 493 628.00 | 568 187.00 | 115.10% |
| 31.03.2019 | 1 059 199.00 | 1 010 344.00 | 48 855.00 | 4.84% | 508 238.00 | 550 961.00 | 108.41% |
| 31.12.2018 | 1 010 344.00 | 544 520.00 | 465 824.00 | 85.55% | 436 907.00 | 573 437.00 | 131.25% |
| 30.09.2018 | 544 520.00 | 493 628.00 | 50 892.00 | 10.31% | 418 109.00 | 126 411.00 | 30.23% |
| 30.06.2018 | 493 628.00 | 508 238.00 | -14 610.00 | -2.87% | 411 669.00 | 81 959.00 | 19.91% |
| 31.03.2018 | 508 238.00 | 436 907.00 | 71 331.00 | 16.33% | 410 540.00 | 97 698.00 | 23.80% |
| 31.12.2017 | 436 907.00 | 418 109.00 | 18 798.00 | 4.50% | 408 686.00 | 28 221.00 | 6.91% |
| 30.09.2017 | 418 109.00 | 411 669.00 | 6 440.00 | 1.56% | 439 834.00 | -21 725.00 | -4.94% |
| 30.06.2017 | 411 669.00 | 410 540.00 | 1 129.00 | 0.28% | 429 955.00 | -18 286.00 | -4.25% |
| 31.03.2017 | 410 540.00 | 408 686.00 | 1 854.00 | 0.45% | 428 263.00 | -17 723.00 | -4.14% |
| 31.12.2016 | 408 686.00 | 439 834.00 | -31 148.00 | -7.08% | 399 044.00 | 9 642.00 | 2.42% |
| 30.09.2016 | 439 834.00 | 429 955.00 | 9 879.00 | 2.30% | 394 916.00 | 44 918.00 | 11.37% |
| 30.06.2016 | 429 955.00 | 428 263.00 | 1 692.00 | 0.40% | 365 080.00 | 64 875.00 | 17.77% |
| 31.03.2016 | 428 263.00 | 399 044.00 | 29 219.00 | 7.32% | 362 850.00 | 65 413.00 | 18.03% |
| 31.12.2015 | 399 044.00 | 394 916.00 | 4 128.00 | 1.05% | 361 284.00 | 37 760.00 | 10.45% |
| 30.09.2015 | 394 916.00 | 365 080.00 | 29 836.00 | 8.17% | 352 545.00 | 42 371.00 | 12.02% |
| 30.06.2015 | 365 080.00 | 362 850.00 | 2 230.00 | 0.61% | 349 094.00 | 15 986.00 | 4.58% |
| 31.03.2015 | 362 850.00 | 361 284.00 | 1 566.00 | 0.43% | 361 974.00 | 876.00 | 0.24% |
| 31.12.2014 | 361 284.00 | 352 545.00 | 8 739.00 | 2.48% | 329 509.00 | 31 775.00 | 9.64% |
| 30.09.2014 | 352 545.00 | 349 094.00 | 3 451.00 | 0.99% | 330 121.00 | 22 424.00 | 6.79% |
| 30.06.2014 | 349 094.00 | 361 974.00 | -12 880.00 | -3.56% | 324 557.00 | 24 537.00 | 7.56% |
| 31.03.2014 | 361 974.00 | 329 509.00 | 32 465.00 | 9.85% | 316 918.00 | 45 056.00 | 14.22% |
| 31.12.2013 | 329 509.00 | 330 121.00 | - 612.00 | -0.19% | 321 434.00 | 8 075.00 | 2.51% |
| 30.09.2013 | 330 121.00 | 324 557.00 | 5 564.00 | 1.71% | 322 658.00 | 7 463.00 | 2.31% |
| 30.06.2013 | 324 557.00 | 316 918.00 | 7 639.00 | 2.41% | 311 182.00 | 13 375.00 | 4.30% |
| 31.03.2013 | 316 918.00 | 321 434.00 | -4 516.00 | -1.40% | 301 071.00 | 15 847.00 | 5.26% |
| 31.12.2012 | 321 434.00 | 322 658.00 | -1 224.00 | -0.38% | 277 712.00 | 43 722.00 | 15.74% |
| 30.09.2012 | 322 658.00 | 311 182.00 | 11 476.00 | 3.69% | 280 674.00 | 41 984.00 | 14.96% |
| 30.06.2012 | 311 182.00 | 301 071.00 | 10 111.00 | 3.36% | 285 492.00 | 25 690.00 | 9.00% |
| 31.03.2012 | 301 071.00 | 277 712.00 | 23 359.00 | 8.41% | 281 900.00 | 19 171.00 | 6.80% |
| 31.12.2011 | 277 712.00 | 280 674.00 | -2 962.00 | -1.06% | 272 819.00 | 4 893.00 | 1.79% |
| 30.09.2011 | 280 674.00 | 285 492.00 | -4 818.00 | -1.69% | 270 378.00 | 10 296.00 | 3.81% |
| 30.06.2011 | 285 492.00 | 281 900.00 | 3 592.00 | 1.27% | 267 433.00 | 18 059.00 | 6.75% |
| 31.03.2011 | 281 900.00 | 272 819.00 | 9 081.00 | 3.33% | 254 492.00 | 27 408.00 | 10.77% |
| 31.12.2010 | 272 819.00 | 270 378.00 | 2 441.00 | 0.90% | 251 025.00 | 21 794.00 | 8.68% |
| 30.09.2010 | 270 378.00 | 267 433.00 | 2 945.00 | 1.10% | 252 170.00 | 18 208.00 | 7.22% |
| 30.06.2010 | 267 433.00 | 254 492.00 | 12 941.00 | 5.08% | 247 812.00 | 19 621.00 | 7.92% |
| 31.03.2010 | 254 492.00 | 251 025.00 | 3 467.00 | 1.38% | 249 548.00 | 4 944.00 | 1.98% |
| 31.12.2009 | 251 025.00 | 252 170.00 | -1 145.00 | -0.45% | 232 337.00 | 18 688.00 | 8.04% |
| 30.09.2009 | 252 170.00 | 247 812.00 | 4 358.00 | 1.76% | 236 325.00 | 15 845.00 | 6.70% |
| 30.06.2009 | 247 812.00 | 249 548.00 | -1 736.00 | -0.70% | 225 728.00 | 22 084.00 | 9.78% |
| 31.03.2009 | 249 548.00 | 232 337.00 | 17 211.00 | 7.41% | 211 097.00 | 38 451.00 | 18.21% |
| 31.12.2008 | 232 337.00 | 236 325.00 | -3 988.00 | -1.69% | 209 473.00 | 22 864.00 | 10.91% |
| 30.09.2008 | 236 325.00 | 225 728.00 | 10 597.00 | 4.69% | 195 576.00 | 40 749.00 | 20.84% |
| 30.06.2008 | 225 728.00 | 211 097.00 | 14 631.00 | 6.93% | 193 727.00 | 32 001.00 | 16.52% |
| 31.03.2008 | 211 097.00 | 209 473.00 | 1 624.00 | 0.78% | 193 787.00 | 17 310.00 | 8.93% |
| 31.12.2007 | 209 473.00 | 195 576.00 | 13 897.00 | 7.11% | 181 149.00 | 28 324.00 | 15.64% |
| 30.09.2007 | 195 576.00 | 193 727.00 | 1 849.00 | 0.95% | 181 083.00 | 14 493.00 | 8.00% |
| 30.06.2007 | 193 727.00 | 193 787.00 | -60.00 | -0.03% | 177 380.00 | 16 347.00 | 9.22% |
| 31.03.2007 | 193 787.00 | 181 149.00 | 12 638.00 | 6.98% | 176 533.00 | 17 254.00 | 9.77% |
| 31.12.2006 | 181 149.00 | 181 083.00 | 66.00 | 0.04% | 172 814.00 | 8 335.00 | 4.82% |
| 30.09.2006 | 181 083.00 | 177 380.00 | 3 703.00 | 2.09% | 172 868.00 | 8 215.00 | 4.75% |
| 30.06.2006 | 177 380.00 | 176 533.00 | 847.00 | 0.48% | 171 460.00 | 5 920.00 | 3.45% |
| 31.03.2006 | 176 533.00 | 172 814.00 | 3 719.00 | 2.15% | 170 660.00 | 5 873.00 | 3.44% |
| 31.12.2005 | 172 814.00 | 172 868.00 | -54.00 | -0.03% | 169 453.00 | 3 361.00 | 1.98% |
| 30.09.2005 | 172 868.00 | 171 460.00 | 1 408.00 | 0.82% | 167 446.00 | 5 422.00 | 3.24% |
| 30.06.2005 | 171 460.00 | 170 660.00 | 800.00 | 0.47% | 164 695.00 | 6 765.00 | 4.11% |
| 31.03.2005 | 170 660.00 | 169 453.00 | 1 207.00 | 0.71% | 162 677.00 | 7 983.00 | 4.91% |
| 31.12.2004 | 169 453.00 | 167 446.00 | 2 007.00 | 1.20% | - | - | - |
| 30.09.2004 | 167 446.00 | 164 695.00 | 2 751.00 | 1.67% | - | - | - |
| 30.06.2004 | 164 695.00 | 162 677.00 | 2 018.00 | 1.24% | - | - | - |
| 31.03.2004 | 162 677.00 | - | - | - | - | - | - |
Graf jako obrázek

Podobné sestavy
Aplikace Ekonomika ČNB ze sekce makroekonomika zobrazuje časové řady hlavních makroekonomických údajů z ekonomiky ČR. Najdete zde přes 10.000 grafů různých hodnot od úrokových sazeb, přes statistiky státního rozpočtu, statistiky ČNB a data zpracovávaná ČSÚ. Data jsou k dispozici obvykle za posledních více než 20 let, od prosince roku 1992. Zdroj dat: ČNB ARAD

