Short-term (AF.31) (Financial assets, stocks, Insurance corporations) - ekonomika ČNB
Aktualizace dat Short-term (AF.31) (Financial assets, stocks, Insurance corporations) v této aplikaci skončila 30.6.2023. Aktualizovná data časových řad najdete na stránkách nové aplikace z dat ARAD ČNB
Nové časové řady makroekonomiky a jejich data
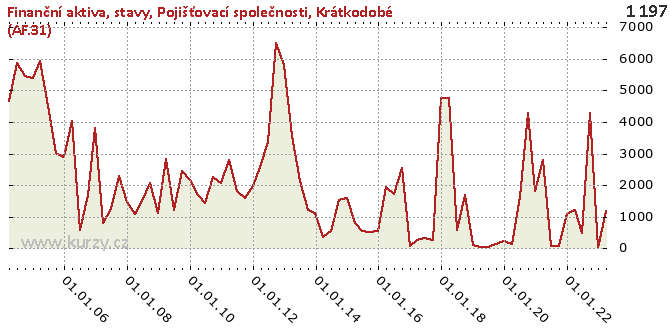
Graf hodnot, Financial assets, stocks, Insurance corporations
Meziroční srovnání
Minima a maxima
| Typ | Období | Hodnota |
|---|---|---|
| Min | 30.06.2019 | 47.00 |
| Min | 31.03.2019 | 47.00 |
| Max | 30.09.2012 | 6 508.00 |
Historické hodnoty
| Období | Hodnota | Předchozí | Rozdíl | Změna | Před rokem | Rozdíl | Změna |
|---|---|---|---|---|---|---|---|
| 31.03.2020 | 130.00 | 239.00 | - 109.00 | -45.61% | 47.00 | 83.00 | 176.60% |
| 31.12.2019 | 239.00 | 147.00 | 92.00 | 62.59% | 117.00 | 122.00 | 104.27% |
| 30.09.2019 | 147.00 | 47.00 | 100.00 | 212.77% | 1 699.00 | -1 552.00 | -91.35% |
| 30.06.2019 | 47.00 | 47.00 | 0.00 | 0.00 | 568.00 | - 521.00 | -91.73% |
| 31.03.2019 | 47.00 | 117.00 | -70.00 | -59.83% | 4 746.00 | -4 699.00 | -99.01% |
| 31.12.2018 | 117.00 | 1 699.00 | -1 582.00 | -93.11% | 4 746.00 | -4 629.00 | -97.53% |
| 30.09.2018 | 1 699.00 | 568.00 | 1 131.00 | 199.12% | 263.00 | 1 436.00 | 546.01% |
| 30.06.2018 | 568.00 | 4 746.00 | -4 178.00 | -88.03% | 343.00 | 225.00 | 65.60% |
| 31.03.2018 | 4 746.00 | 4 746.00 | 0.00 | 0.00 | 267.00 | 4 479.00 | 1 677.53% |
| 31.12.2017 | 4 746.00 | 263.00 | 4 483.00 | 1 704.56% | 84.00 | 4 662.00 | 5 550.00% |
| 30.09.2017 | 263.00 | 343.00 | -80.00 | -23.32% | 2 543.00 | -2 280.00 | -89.66% |
| 30.06.2017 | 343.00 | 267.00 | 76.00 | 28.46% | 1 705.00 | -1 362.00 | -79.88% |
| 31.03.2017 | 267.00 | 84.00 | 183.00 | 217.86% | 1 927.00 | -1 660.00 | -86.14% |
| 31.12.2016 | 84.00 | 2 543.00 | -2 459.00 | -96.70% | 547.00 | - 463.00 | -84.64% |
| 30.09.2016 | 2 543.00 | 1 705.00 | 838.00 | 49.15% | 516.00 | 2 027.00 | 392.83% |
| 30.06.2016 | 1 705.00 | 1 927.00 | - 222.00 | -11.52% | 551.00 | 1 154.00 | 209.44% |
| 31.03.2016 | 1 927.00 | 547.00 | 1 380.00 | 252.29% | 801.00 | 1 126.00 | 140.57% |
| 31.12.2015 | 547.00 | 516.00 | 31.00 | 6.01% | 1 585.00 | -1 038.00 | -65.49% |
| 30.09.2015 | 516.00 | 551.00 | -35.00 | -6.35% | 1 525.00 | -1 009.00 | -66.16% |
| 30.06.2015 | 551.00 | 801.00 | - 250.00 | -31.21% | 548.00 | 3.00 | 0.55% |
| 31.03.2015 | 801.00 | 1 585.00 | - 784.00 | -49.46% | 356.00 | 445.00 | 125.00% |
| 31.12.2014 | 1 585.00 | 1 525.00 | 60.00 | 3.93% | 1 104.00 | 481.00 | 43.57% |
| 30.09.2014 | 1 525.00 | 548.00 | 977.00 | 178.28% | 1 212.00 | 313.00 | 25.82% |
| 30.06.2014 | 548.00 | 356.00 | 192.00 | 53.93% | 2 146.00 | -1 598.00 | -74.46% |
| 31.03.2014 | 356.00 | 1 104.00 | - 748.00 | -67.75% | 3 550.00 | -3 194.00 | -89.97% |
| 31.12.2013 | 1 104.00 | 1 212.00 | - 108.00 | -8.91% | 5 790.00 | -4 686.00 | -80.93% |
| 30.09.2013 | 1 212.00 | 2 146.00 | - 934.00 | -43.52% | 6 508.00 | -5 296.00 | -81.38% |
| 30.06.2013 | 2 146.00 | 3 550.00 | -1 404.00 | -39.55% | 3 360.00 | -1 214.00 | -36.13% |
| 31.03.2013 | 3 550.00 | 5 790.00 | -2 240.00 | -38.69% | 2 572.00 | 978.00 | 38.02% |
| 31.12.2012 | 5 790.00 | 6 508.00 | - 718.00 | -11.03% | 1 980.00 | 3 810.00 | 192.42% |
| 30.09.2012 | 6 508.00 | 3 360.00 | 3 148.00 | 93.69% | 1 591.00 | 4 917.00 | 309.05% |
| 30.06.2012 | 3 360.00 | 2 572.00 | 788.00 | 30.64% | 1 810.00 | 1 550.00 | 85.64% |
| 31.03.2012 | 2 572.00 | 1 980.00 | 592.00 | 29.90% | 2 790.00 | - 218.00 | -7.81% |
| 31.12.2011 | 1 980.00 | 1 591.00 | 389.00 | 24.45% | 2 061.00 | -81.00 | -3.93% |
| 30.09.2011 | 1 591.00 | 1 810.00 | - 219.00 | -12.10% | 2 269.00 | - 678.00 | -29.88% |
| 30.06.2011 | 1 810.00 | 2 790.00 | - 980.00 | -35.13% | 1 428.00 | 382.00 | 26.75% |
| 31.03.2011 | 2 790.00 | 2 061.00 | 729.00 | 35.37% | 1 685.00 | 1 105.00 | 65.58% |
| 31.12.2010 | 2 061.00 | 2 269.00 | - 208.00 | -9.17% | 2 152.00 | -91.00 | -4.23% |
| 30.09.2010 | 2 269.00 | 1 428.00 | 841.00 | 58.89% | 2 440.00 | - 171.00 | -7.01% |
| 30.06.2010 | 1 428.00 | 1 685.00 | - 257.00 | -15.25% | 1 214.00 | 214.00 | 17.63% |
| 31.03.2010 | 1 685.00 | 2 152.00 | - 467.00 | -21.70% | 2 842.00 | -1 157.00 | -40.71% |
| 31.12.2009 | 2 152.00 | 2 440.00 | - 288.00 | -11.80% | 1 123.00 | 1 029.00 | 91.63% |
| 30.09.2009 | 2 440.00 | 1 214.00 | 1 226.00 | 100.99% | 2 078.00 | 362.00 | 17.42% |
| 30.06.2009 | 1 214.00 | 2 842.00 | -1 628.00 | -57.28% | 1 564.00 | - 350.00 | -22.38% |
| 31.03.2009 | 2 842.00 | 1 123.00 | 1 719.00 | 153.07% | 1 076.00 | 1 766.00 | 164.13% |
| 31.12.2008 | 1 123.00 | 2 078.00 | - 955.00 | -45.96% | 1 479.00 | - 356.00 | -24.07% |
| 30.09.2008 | 2 078.00 | 1 564.00 | 514.00 | 32.86% | 2 274.00 | - 196.00 | -8.62% |
| 30.06.2008 | 1 564.00 | 1 076.00 | 488.00 | 45.35% | 1 246.00 | 318.00 | 25.52% |
| 31.03.2008 | 1 076.00 | 1 479.00 | - 403.00 | -27.25% | 814.00 | 262.00 | 32.19% |
| 31.12.2007 | 1 479.00 | 2 274.00 | - 795.00 | -34.96% | 3 819.00 | -2 340.00 | -61.27% |
| 30.09.2007 | 2 274.00 | 1 246.00 | 1 028.00 | 82.50% | 1 695.00 | 579.00 | 34.16% |
| 30.06.2007 | 1 246.00 | 814.00 | 432.00 | 53.07% | 581.00 | 665.00 | 114.46% |
| 31.03.2007 | 814.00 | 3 819.00 | -3 005.00 | -78.69% | 4 023.00 | -3 209.00 | -79.77% |
| 31.12.2006 | 3 819.00 | 1 695.00 | 2 124.00 | 125.31% | 2 902.00 | 917.00 | 31.60% |
| 30.09.2006 | 1 695.00 | 581.00 | 1 114.00 | 191.74% | 3 018.00 | -1 323.00 | -43.84% |
| 30.06.2006 | 581.00 | 4 023.00 | -3 442.00 | -85.56% | 4 492.00 | -3 911.00 | -87.07% |
| 31.03.2006 | 4 023.00 | 2 902.00 | 1 121.00 | 38.63% | 5 926.00 | -1 903.00 | -32.11% |
| 31.12.2005 | 2 902.00 | 3 018.00 | - 116.00 | -3.84% | 5 397.00 | -2 495.00 | -46.23% |
| 30.09.2005 | 3 018.00 | 4 492.00 | -1 474.00 | -32.81% | 5 444.00 | -2 426.00 | -44.56% |
| 30.06.2005 | 4 492.00 | 5 926.00 | -1 434.00 | -24.20% | 5 872.00 | -1 380.00 | -23.50% |
| 31.03.2005 | 5 926.00 | 5 397.00 | 529.00 | 9.80% | 4 672.00 | 1 254.00 | 26.84% |
| 31.12.2004 | 5 397.00 | 5 444.00 | -47.00 | -0.86% | - | - | - |
| 30.09.2004 | 5 444.00 | 5 872.00 | - 428.00 | -7.29% | - | - | - |
| 30.06.2004 | 5 872.00 | 4 672.00 | 1 200.00 | 25.68% | - | - | - |
| 31.03.2004 | 4 672.00 | - | - | - | - | - | - |
Graf jako obrázek

Podobné sestavy
Aplikace Ekonomika ČNB ze sekce makroekonomika zobrazuje časové řady hlavních makroekonomických údajů z ekonomiky ČR. Najdete zde přes 10.000 grafů různých hodnot od úrokových sazeb, přes statistiky státního rozpočtu, statistiky ČNB a data zpracovávaná ČSÚ. Data jsou k dispozici obvykle za posledních více než 20 let, od prosince roku 1992. Zdroj dat: ČNB ARAD

