Other accounts receivable excluding trade credits and advances (AF.89) - ekonomika ČNB
Aktualizace dat Other accounts receivable excluding trade credits and advances (AF.89) v této aplikaci skončila 30.6.2023. Aktualizovná data časových řad najdete na stránkách nové aplikace z dat ARAD ČNB
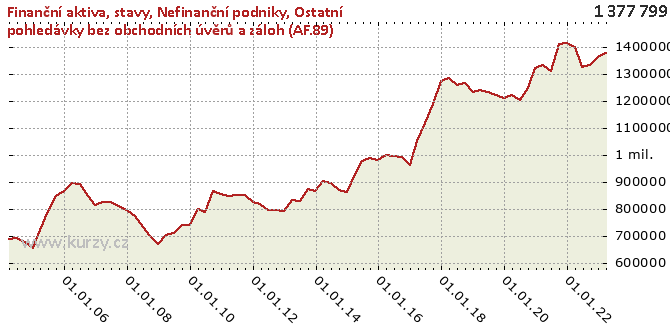
Graf hodnot, Financial assets, stocks, Non-financial corporation
Meziroční srovnání
Minima a maxima
| Typ | Období | Hodnota |
|---|---|---|
| Max | 31.03.2018 | 1 285 514.00 |
| Min | 31.12.2004 | 653 607.00 |
Historické hodnoty
| Období | Hodnota | Předchozí | Rozdíl | Změna | Před rokem | Rozdíl | Změna |
|---|---|---|---|---|---|---|---|
| 31.03.2020 | 1 235 803.00 | 1 211 518.00 | 24 285.00 | 2.00% | 1 241 553.00 | -5 750.00 | -0.46% |
| 31.12.2019 | 1 211 518.00 | 1 221 609.00 | -10 091.00 | -0.83% | 1 234 271.00 | -22 753.00 | -1.84% |
| 30.09.2019 | 1 221 609.00 | 1 233 328.00 | -11 719.00 | -0.95% | 1 266 736.00 | -45 127.00 | -3.56% |
| 30.06.2019 | 1 233 328.00 | 1 241 553.00 | -8 225.00 | -0.66% | 1 258 213.00 | -24 885.00 | -1.98% |
| 31.03.2019 | 1 241 553.00 | 1 234 271.00 | 7 282.00 | 0.59% | 1 285 514.00 | -43 961.00 | -3.42% |
| 31.12.2018 | 1 234 271.00 | 1 266 736.00 | -32 465.00 | -2.56% | 1 274 728.00 | -40 457.00 | -3.17% |
| 30.09.2018 | 1 266 736.00 | 1 258 213.00 | 8 523.00 | 0.68% | 1 187 014.00 | 79 722.00 | 6.72% |
| 30.06.2018 | 1 258 213.00 | 1 285 514.00 | -27 301.00 | -2.12% | 1 118 799.00 | 139 414.00 | 12.46% |
| 31.03.2018 | 1 285 514.00 | 1 274 728.00 | 10 786.00 | 0.85% | 1 052 359.00 | 233 155.00 | 22.16% |
| 31.12.2017 | 1 274 728.00 | 1 187 014.00 | 87 714.00 | 7.39% | 963 599.00 | 311 129.00 | 32.29% |
| 30.09.2017 | 1 187 014.00 | 1 118 799.00 | 68 215.00 | 6.10% | 993 160.00 | 193 854.00 | 19.52% |
| 30.06.2017 | 1 118 799.00 | 1 052 359.00 | 66 440.00 | 6.31% | 997 513.00 | 121 286.00 | 12.16% |
| 31.03.2017 | 1 052 359.00 | 963 599.00 | 88 760.00 | 9.21% | 1 000 077.00 | 52 282.00 | 5.23% |
| 31.12.2016 | 963 599.00 | 993 160.00 | -29 561.00 | -2.98% | 980 639.00 | -17 040.00 | -1.74% |
| 30.09.2016 | 993 160.00 | 997 513.00 | -4 353.00 | -0.44% | 989 432.00 | 3 728.00 | 0.38% |
| 30.06.2016 | 997 513.00 | 1 000 077.00 | -2 564.00 | -0.26% | 976 140.00 | 21 373.00 | 2.19% |
| 31.03.2016 | 1 000 077.00 | 980 639.00 | 19 438.00 | 1.98% | 927 860.00 | 72 217.00 | 7.78% |
| 31.12.2015 | 980 639.00 | 989 432.00 | -8 793.00 | -0.89% | 862 494.00 | 118 145.00 | 13.70% |
| 30.09.2015 | 989 432.00 | 976 140.00 | 13 292.00 | 1.36% | 868 818.00 | 120 614.00 | 13.88% |
| 30.06.2015 | 976 140.00 | 927 860.00 | 48 280.00 | 5.20% | 894 515.00 | 81 625.00 | 9.12% |
| 31.03.2015 | 927 860.00 | 862 494.00 | 65 366.00 | 7.58% | 901 851.00 | 26 009.00 | 2.88% |
| 31.12.2014 | 862 494.00 | 868 818.00 | -6 324.00 | -0.73% | 864 946.00 | -2 452.00 | -0.28% |
| 30.09.2014 | 868 818.00 | 894 515.00 | -25 697.00 | -2.87% | 871 937.00 | -3 119.00 | -0.36% |
| 30.06.2014 | 894 515.00 | 901 851.00 | -7 336.00 | -0.81% | 828 168.00 | 66 347.00 | 8.01% |
| 31.03.2014 | 901 851.00 | 864 946.00 | 36 905.00 | 4.27% | 831 891.00 | 69 960.00 | 8.41% |
| 31.12.2013 | 864 946.00 | 871 937.00 | -6 991.00 | -0.80% | 791 455.00 | 73 491.00 | 9.29% |
| 30.09.2013 | 871 937.00 | 828 168.00 | 43 769.00 | 5.29% | 796 443.00 | 75 494.00 | 9.48% |
| 30.06.2013 | 828 168.00 | 831 891.00 | -3 723.00 | -0.45% | 794 171.00 | 33 997.00 | 4.28% |
| 31.03.2013 | 831 891.00 | 791 455.00 | 40 436.00 | 5.11% | 817 787.00 | 14 104.00 | 1.72% |
| 31.12.2012 | 791 455.00 | 796 443.00 | -4 988.00 | -0.63% | 826 971.00 | -35 516.00 | -4.29% |
| 30.09.2012 | 796 443.00 | 794 171.00 | 2 272.00 | 0.29% | 853 081.00 | -56 638.00 | -6.64% |
| 30.06.2012 | 794 171.00 | 817 787.00 | -23 616.00 | -2.89% | 852 927.00 | -58 756.00 | -6.89% |
| 31.03.2012 | 817 787.00 | 826 971.00 | -9 184.00 | -1.11% | 846 904.00 | -29 117.00 | -3.44% |
| 31.12.2011 | 826 971.00 | 853 081.00 | -26 110.00 | -3.06% | 854 628.00 | -27 657.00 | -3.24% |
| 30.09.2011 | 853 081.00 | 852 927.00 | 154.00 | 0.02% | 867 469.00 | -14 388.00 | -1.66% |
| 30.06.2011 | 852 927.00 | 846 904.00 | 6 023.00 | 0.71% | 789 068.00 | 63 859.00 | 8.09% |
| 31.03.2011 | 846 904.00 | 854 628.00 | -7 724.00 | -0.90% | 800 364.00 | 46 540.00 | 5.81% |
| 31.12.2010 | 854 628.00 | 867 469.00 | -12 841.00 | -1.48% | 741 563.00 | 113 065.00 | 15.25% |
| 30.09.2010 | 867 469.00 | 789 068.00 | 78 401.00 | 9.94% | 741 049.00 | 126 420.00 | 17.06% |
| 30.06.2010 | 789 068.00 | 800 364.00 | -11 296.00 | -1.41% | 711 247.00 | 77 821.00 | 10.94% |
| 31.03.2010 | 800 364.00 | 741 563.00 | 58 801.00 | 7.93% | 703 867.00 | 96 497.00 | 13.71% |
| 31.12.2009 | 741 563.00 | 741 049.00 | 514.00 | 0.07% | 671 074.00 | 70 489.00 | 10.50% |
| 30.09.2009 | 741 049.00 | 711 247.00 | 29 802.00 | 4.19% | 699 139.00 | 41 910.00 | 5.99% |
| 30.06.2009 | 711 247.00 | 703 867.00 | 7 380.00 | 1.05% | 733 856.00 | -22 609.00 | -3.08% |
| 31.03.2009 | 703 867.00 | 671 074.00 | 32 793.00 | 4.89% | 774 273.00 | -70 406.00 | -9.09% |
| 31.12.2008 | 671 074.00 | 699 139.00 | -28 065.00 | -4.01% | 794 063.00 | - 122 989.00 | -15.49% |
| 30.09.2008 | 699 139.00 | 733 856.00 | -34 717.00 | -4.73% | 811 681.00 | - 112 542.00 | -13.87% |
| 30.06.2008 | 733 856.00 | 774 273.00 | -40 417.00 | -5.22% | 824 962.00 | -91 106.00 | -11.04% |
| 31.03.2008 | 774 273.00 | 794 063.00 | -19 790.00 | -2.49% | 826 658.00 | -52 385.00 | -6.34% |
| 31.12.2007 | 794 063.00 | 811 681.00 | -17 618.00 | -2.17% | 815 567.00 | -21 504.00 | -2.64% |
| 30.09.2007 | 811 681.00 | 824 962.00 | -13 281.00 | -1.61% | 847 937.00 | -36 256.00 | -4.28% |
| 30.06.2007 | 824 962.00 | 826 658.00 | -1 696.00 | -0.21% | 890 326.00 | -65 364.00 | -7.34% |
| 31.03.2007 | 826 658.00 | 815 567.00 | 11 091.00 | 1.36% | 895 413.00 | -68 755.00 | -7.68% |
| 31.12.2006 | 815 567.00 | 847 937.00 | -32 370.00 | -3.82% | 867 049.00 | -51 482.00 | -5.94% |
| 30.09.2006 | 847 937.00 | 890 326.00 | -42 389.00 | -4.76% | 846 450.00 | 1 487.00 | 0.18% |
| 30.06.2006 | 890 326.00 | 895 413.00 | -5 087.00 | -0.57% | 793 438.00 | 96 888.00 | 12.21% |
| 31.03.2006 | 895 413.00 | 867 049.00 | 28 364.00 | 3.27% | 722 146.00 | 173 267.00 | 23.99% |
| 31.12.2005 | 867 049.00 | 846 450.00 | 20 599.00 | 2.43% | 653 607.00 | 213 442.00 | 32.66% |
| 30.09.2005 | 846 450.00 | 793 438.00 | 53 012.00 | 6.68% | 678 733.00 | 167 717.00 | 24.71% |
| 30.06.2005 | 793 438.00 | 722 146.00 | 71 292.00 | 9.87% | 693 046.00 | 100 392.00 | 14.49% |
| 31.03.2005 | 722 146.00 | 653 607.00 | 68 539.00 | 10.49% | 688 121.00 | 34 025.00 | 4.94% |
| 31.12.2004 | 653 607.00 | 678 733.00 | -25 126.00 | -3.70% | - | - | - |
| 30.09.2004 | 678 733.00 | 693 046.00 | -14 313.00 | -2.07% | - | - | - |
| 30.06.2004 | 693 046.00 | 688 121.00 | 4 925.00 | 0.72% | - | - | - |
| 31.03.2004 | 688 121.00 | - | - | - | - | - | - |
Graf jako obrázek

Podobné sestavy
Aplikace Ekonomika ČNB ze sekce makroekonomika zobrazuje časové řady hlavních makroekonomických údajů z ekonomiky ČR. Najdete zde přes 10.000 grafů různých hodnot od úrokových sazeb, přes statistiky státního rozpočtu, statistiky ČNB a data zpracovávaná ČSÚ. Data jsou k dispozici obvykle za posledních více než 20 let, od prosince roku 1992. Zdroj dat: ČNB ARAD

