Trade credits and advances (AF.81) (Financial assets, stocks, Other financial institutions) - ekonomika ČNB
Aktualizace dat Trade credits and advances (AF.81) (Financial assets, stocks, Other financial institutions) v této aplikaci skončila 30.6.2023. Aktualizovná data časových řad najdete na stránkách nové aplikace z dat ARAD ČNB
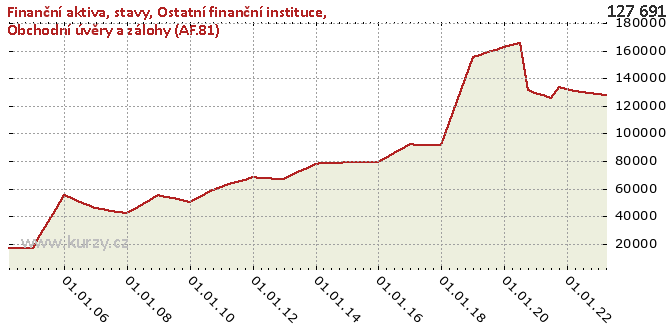
Graf hodnot, Financial assets, stocks, Other financial institutions
Meziroční srovnání
Minima a maxima
| Typ | Období | Hodnota |
|---|---|---|
| Max | 31.03.2020 | 162 701.00 |
| Min | 31.12.2004 | 16 834.00 |
| Min | 30.09.2004 | 16 834.00 |
| Min | 30.06.2004 | 16 834.00 |
| Min | 31.03.2004 | 16 834.00 |
Historické hodnoty
| Období | Hodnota | Předchozí | Rozdíl | Změna | Před rokem | Rozdíl | Změna |
|---|---|---|---|---|---|---|---|
| 31.03.2020 | 162 701.00 | 162 265.00 | 436.00 | 0.27% | 157 023.00 | 5 678.00 | 3.62% |
| 31.12.2019 | 162 265.00 | 160 518.00 | 1 747.00 | 1.09% | 155 275.00 | 6 990.00 | 4.50% |
| 30.09.2019 | 160 518.00 | 158 771.00 | 1 747.00 | 1.10% | 139 310.00 | 21 208.00 | 15.22% |
| 30.06.2019 | 158 771.00 | 157 023.00 | 1 748.00 | 1.11% | 123 346.00 | 35 425.00 | 28.72% |
| 31.03.2019 | 157 023.00 | 155 275.00 | 1 748.00 | 1.13% | 107 381.00 | 49 642.00 | 46.23% |
| 31.12.2018 | 155 275.00 | 139 310.00 | 15 965.00 | 11.46% | 91 415.00 | 63 860.00 | 69.86% |
| 30.09.2018 | 139 310.00 | 123 346.00 | 15 964.00 | 12.94% | 91 615.00 | 47 695.00 | 52.06% |
| 30.06.2018 | 123 346.00 | 107 381.00 | 15 965.00 | 14.87% | 91 816.00 | 31 530.00 | 34.34% |
| 31.03.2018 | 107 381.00 | 91 415.00 | 15 966.00 | 17.47% | 92 015.00 | 15 366.00 | 16.70% |
| 31.12.2017 | 91 415.00 | 91 615.00 | - 200.00 | -0.22% | 92 215.00 | - 800.00 | -0.87% |
| 30.09.2017 | 91 615.00 | 91 816.00 | - 201.00 | -0.22% | 88 916.00 | 2 699.00 | 3.04% |
| 30.06.2017 | 91 816.00 | 92 015.00 | - 199.00 | -0.22% | 85 616.00 | 6 200.00 | 7.24% |
| 31.03.2017 | 92 015.00 | 92 215.00 | - 200.00 | -0.22% | 82 317.00 | 9 698.00 | 11.78% |
| 31.12.2016 | 92 215.00 | 88 916.00 | 3 299.00 | 3.71% | 79 016.00 | 13 199.00 | 16.70% |
| 30.09.2016 | 88 916.00 | 85 616.00 | 3 300.00 | 3.85% | 79 030.00 | 9 886.00 | 12.51% |
| 30.06.2016 | 85 616.00 | 82 317.00 | 3 299.00 | 4.01% | 79 043.00 | 6 573.00 | 8.32% |
| 31.03.2016 | 82 317.00 | 79 016.00 | 3 301.00 | 4.18% | 79 055.00 | 3 262.00 | 4.13% |
| 31.12.2015 | 79 016.00 | 79 030.00 | -14.00 | -0.02% | 79 068.00 | -52.00 | -0.07% |
| 30.09.2015 | 79 030.00 | 79 043.00 | -13.00 | -0.02% | 78 825.00 | 205.00 | 0.26% |
| 30.06.2015 | 79 043.00 | 79 055.00 | -12.00 | -0.02% | 78 581.00 | 462.00 | 0.59% |
| 31.03.2015 | 79 055.00 | 79 068.00 | -13.00 | -0.02% | 78 337.00 | 718.00 | 0.92% |
| 31.12.2014 | 79 068.00 | 78 825.00 | 243.00 | 0.31% | 78 093.00 | 975.00 | 1.25% |
| 30.09.2014 | 78 825.00 | 78 581.00 | 244.00 | 0.31% | 75 312.00 | 3 513.00 | 4.66% |
| 30.06.2014 | 78 581.00 | 78 337.00 | 244.00 | 0.31% | 72 532.00 | 6 049.00 | 8.34% |
| 31.03.2014 | 78 337.00 | 78 093.00 | 244.00 | 0.31% | 69 750.00 | 8 587.00 | 12.31% |
| 31.12.2013 | 78 093.00 | 75 312.00 | 2 781.00 | 3.69% | 66 969.00 | 11 124.00 | 16.61% |
| 30.09.2013 | 75 312.00 | 72 532.00 | 2 780.00 | 3.83% | 67 284.00 | 8 028.00 | 11.93% |
| 30.06.2013 | 72 532.00 | 69 750.00 | 2 782.00 | 3.99% | 67 600.00 | 4 932.00 | 7.30% |
| 31.03.2013 | 69 750.00 | 66 969.00 | 2 781.00 | 4.15% | 67 915.00 | 1 835.00 | 2.70% |
| 31.12.2012 | 66 969.00 | 67 284.00 | - 315.00 | -0.47% | 68 229.00 | -1 260.00 | -1.85% |
| 30.09.2012 | 67 284.00 | 67 600.00 | - 316.00 | -0.47% | 66 553.00 | 731.00 | 1.10% |
| 30.06.2012 | 67 600.00 | 67 915.00 | - 315.00 | -0.46% | 64 878.00 | 2 722.00 | 4.20% |
| 31.03.2012 | 67 915.00 | 68 229.00 | - 314.00 | -0.46% | 63 201.00 | 4 714.00 | 7.46% |
| 31.12.2011 | 68 229.00 | 66 553.00 | 1 676.00 | 2.52% | 61 525.00 | 6 704.00 | 10.90% |
| 30.09.2011 | 66 553.00 | 64 878.00 | 1 675.00 | 2.58% | 58 767.00 | 7 786.00 | 13.25% |
| 30.06.2011 | 64 878.00 | 63 201.00 | 1 677.00 | 2.65% | 56 009.00 | 8 869.00 | 15.83% |
| 31.03.2011 | 63 201.00 | 61 525.00 | 1 676.00 | 2.72% | 53 249.00 | 9 952.00 | 18.69% |
| 31.12.2010 | 61 525.00 | 58 767.00 | 2 758.00 | 4.69% | 50 491.00 | 11 034.00 | 21.85% |
| 30.09.2010 | 58 767.00 | 56 009.00 | 2 758.00 | 4.92% | 51 734.00 | 7 033.00 | 13.59% |
| 30.06.2010 | 56 009.00 | 53 249.00 | 2 760.00 | 5.18% | 52 976.00 | 3 033.00 | 5.73% |
| 31.03.2010 | 53 249.00 | 50 491.00 | 2 758.00 | 5.46% | 54 218.00 | - 969.00 | -1.79% |
| 31.12.2009 | 50 491.00 | 51 734.00 | -1 243.00 | -2.40% | 55 460.00 | -4 969.00 | -8.96% |
| 30.09.2009 | 51 734.00 | 52 976.00 | -1 242.00 | -2.34% | 52 181.00 | - 447.00 | -0.86% |
| 30.06.2009 | 52 976.00 | 54 218.00 | -1 242.00 | -2.29% | 48 902.00 | 4 074.00 | 8.33% |
| 31.03.2009 | 54 218.00 | 55 460.00 | -1 242.00 | -2.24% | 45 622.00 | 8 596.00 | 18.84% |
| 31.12.2008 | 55 460.00 | 52 181.00 | 3 279.00 | 6.28% | 42 342.00 | 13 118.00 | 30.98% |
| 30.09.2008 | 52 181.00 | 48 902.00 | 3 279.00 | 6.71% | 43 279.00 | 8 902.00 | 20.57% |
| 30.06.2008 | 48 902.00 | 45 622.00 | 3 280.00 | 7.19% | 44 216.00 | 4 686.00 | 10.60% |
| 31.03.2008 | 45 622.00 | 42 342.00 | 3 280.00 | 7.75% | 45 152.00 | 470.00 | 1.04% |
| 31.12.2007 | 42 342.00 | 43 279.00 | - 937.00 | -2.17% | 46 089.00 | -3 747.00 | -8.13% |
| 30.09.2007 | 43 279.00 | 44 216.00 | - 937.00 | -2.12% | 48 389.00 | -5 110.00 | -10.56% |
| 30.06.2007 | 44 216.00 | 45 152.00 | - 936.00 | -2.07% | 50 689.00 | -6 473.00 | -12.77% |
| 31.03.2007 | 45 152.00 | 46 089.00 | - 937.00 | -2.03% | 52 986.00 | -7 834.00 | -14.79% |
| 31.12.2006 | 46 089.00 | 48 389.00 | -2 300.00 | -4.75% | 55 286.00 | -9 197.00 | -16.64% |
| 30.09.2006 | 48 389.00 | 50 689.00 | -2 300.00 | -4.54% | 45 674.00 | 2 715.00 | 5.94% |
| 30.06.2006 | 50 689.00 | 52 986.00 | -2 297.00 | -4.34% | 36 061.00 | 14 628.00 | 40.56% |
| 31.03.2006 | 52 986.00 | 55 286.00 | -2 300.00 | -4.16% | 26 447.00 | 26 539.00 | 100.35% |
| 31.12.2005 | 55 286.00 | 45 674.00 | 9 612.00 | 21.04% | 16 834.00 | 38 452.00 | 228.42% |
| 30.09.2005 | 45 674.00 | 36 061.00 | 9 613.00 | 26.66% | 16 834.00 | 28 840.00 | 171.32% |
| 30.06.2005 | 36 061.00 | 26 447.00 | 9 614.00 | 36.35% | 16 834.00 | 19 227.00 | 114.22% |
| 31.03.2005 | 26 447.00 | 16 834.00 | 9 613.00 | 57.10% | 16 834.00 | 9 613.00 | 57.10% |
| 31.12.2004 | 16 834.00 | 16 834.00 | 0.00 | 0.00 | - | - | - |
| 30.09.2004 | 16 834.00 | 16 834.00 | 0.00 | 0.00 | - | - | - |
| 30.06.2004 | 16 834.00 | 16 834.00 | 0.00 | 0.00 | - | - | - |
| 31.03.2004 | 16 834.00 | - | - | - | - | - | - |
Graf jako obrázek

Podobné sestavy
Aplikace Ekonomika ČNB ze sekce makroekonomika zobrazuje časové řady hlavních makroekonomických údajů z ekonomiky ČR. Najdete zde přes 10.000 grafů různých hodnot od úrokových sazeb, přes statistiky státního rozpočtu, statistiky ČNB a data zpracovávaná ČSÚ. Data jsou k dispozici obvykle za posledních více než 20 let, od prosince roku 1992. Zdroj dat: ČNB ARAD

