Consumer credit and other lending - volume - ekonomika ČNB
Aktualizace dat Consumer credit and other lending - volume v této aplikaci skončila 30.6.2023. Aktualizovná data časových řad najdete na stránkách nové aplikace z dat ARAD ČNB
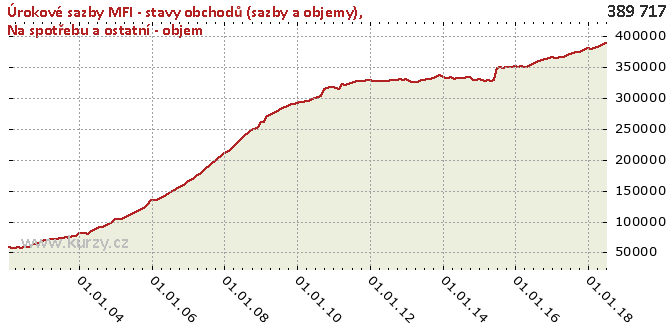
Graf hodnot, MFI interest rates on outstanding amounts (interest rates and volumes)
Meziroční srovnání
Minima a maxima
| Typ | Období | Hodnota |
|---|---|---|
| Max | 30.06.2018 | 389 717.70 |
| Min | 31.05.2002 | 56 576.42 |
Historické hodnoty
| Období | Hodnota | Předchozí | Rozdíl | Změna | Před rokem | Rozdíl | Změna |
|---|---|---|---|---|---|---|---|
| 30.06.2018 | 389 717.70 | 387 569.59 | 2 148.11 | 0.55% | 370 915.92 | 18 801.78 | 5.07% |
| 31.05.2018 | 387 569.59 | 384 429.75 | 3 139.84 | 0.82% | 368 969.72 | 18 599.87 | 5.04% |
| 30.04.2018 | 384 429.75 | 382 681.95 | 1 747.80 | 0.46% | 366 485.67 | 17 944.08 | 4.90% |
| 31.03.2018 | 382 681.95 | 380 756.27 | 1 925.68 | 0.51% | 365 878.51 | 16 803.44 | 4.59% |
| 28.02.2018 | 380 756.27 | 380 088.72 | 667.55 | 0.18% | 364 617.96 | 16 138.31 | 4.43% |
| 31.01.2018 | 380 088.72 | 380 836.42 | - 747.70 | -0.20% | 364 633.58 | 15 455.14 | 4.24% |
| 31.12.2017 | 380 836.42 | 379 180.26 | 1 656.16 | 0.44% | 366 903.00 | 13 933.42 | 3.80% |
| 30.11.2017 | 379 180.26 | 376 815.05 | 2 365.21 | 0.63% | 365 021.90 | 14 158.36 | 3.88% |
| 31.10.2017 | 376 815.05 | 374 057.19 | 2 757.86 | 0.74% | 362 869.58 | 13 945.47 | 3.84% |
| 30.09.2017 | 374 057.19 | 374 972.79 | - 915.60 | -0.24% | 360 826.22 | 13 230.97 | 3.67% |
| 31.08.2017 | 374 972.79 | 373 140.11 | 1 832.68 | 0.49% | 359 389.85 | 15 582.94 | 4.34% |
| 31.07.2017 | 373 140.11 | 370 915.92 | 2 224.19 | 0.60% | 357 681.06 | 15 459.05 | 4.32% |
| 30.06.2017 | 370 915.92 | 368 969.72 | 1 946.20 | 0.53% | 355 457.78 | 15 458.14 | 4.35% |
| 31.05.2017 | 368 969.72 | 366 485.67 | 2 484.05 | 0.68% | 353 368.93 | 15 600.79 | 4.41% |
| 30.04.2017 | 366 485.67 | 365 878.51 | 607.16 | 0.17% | 350 834.55 | 15 651.12 | 4.46% |
| 31.03.2017 | 365 878.51 | 364 617.96 | 1 260.55 | 0.35% | 350 211.42 | 15 667.09 | 4.47% |
| 28.02.2017 | 364 617.96 | 364 633.58 | -15.62 | -0.00% | 352 047.84 | 12 570.12 | 3.57% |
| 31.01.2017 | 364 633.58 | 366 903.00 | -2 269.42 | -0.62% | 350 140.82 | 14 492.76 | 4.14% |
| 31.12.2016 | 366 903.00 | 365 021.90 | 1 881.10 | 0.52% | 351 999.61 | 14 903.39 | 4.23% |
| 30.11.2016 | 365 021.90 | 362 869.58 | 2 152.32 | 0.59% | 350 702.53 | 14 319.37 | 4.08% |
| 31.10.2016 | 362 869.58 | 360 826.22 | 2 043.36 | 0.57% | 350 831.82 | 12 037.76 | 3.43% |
| 30.09.2016 | 360 826.22 | 359 389.85 | 1 436.37 | 0.40% | 350 186.00 | 10 640.22 | 3.04% |
| 31.08.2016 | 359 389.85 | 357 681.06 | 1 708.79 | 0.48% | 349 339.19 | 10 050.66 | 2.88% |
| 31.07.2016 | 357 681.06 | 355 457.78 | 2 223.28 | 0.63% | 349 461.94 | 8 219.12 | 2.35% |
| 30.06.2016 | 355 457.78 | 353 368.93 | 2 088.85 | 0.59% | 348 617.28 | 6 840.50 | 1.96% |
| 31.05.2016 | 353 368.93 | 350 834.55 | 2 534.38 | 0.72% | 329 088.80 | 24 280.13 | 7.38% |
| 30.04.2016 | 350 834.55 | 350 211.42 | 623.13 | 0.18% | 327 763.78 | 23 070.77 | 7.04% |
| 31.03.2016 | 350 211.42 | 352 047.84 | -1 836.42 | -0.52% | 328 616.56 | 21 594.86 | 6.57% |
| 29.02.2016 | 352 047.84 | 350 140.82 | 1 907.02 | 0.54% | 327 795.62 | 24 252.22 | 7.40% |
| 31.01.2016 | 350 140.82 | 351 999.61 | -1 858.79 | -0.53% | 328 573.26 | 21 567.56 | 6.56% |
| 31.12.2015 | 351 999.61 | 350 702.53 | 1 297.08 | 0.37% | 330 440.05 | 21 559.56 | 6.52% |
| 30.11.2015 | 350 702.53 | 350 831.82 | - 129.29 | -0.04% | 329 311.54 | 21 390.99 | 6.50% |
| 31.10.2015 | 350 831.82 | 350 186.00 | 645.82 | 0.18% | 329 661.24 | 21 170.58 | 6.42% |
| 30.09.2015 | 350 186.00 | 349 339.19 | 846.81 | 0.24% | 333 931.51 | 16 254.49 | 4.87% |
| 31.08.2015 | 349 339.19 | 349 461.94 | - 122.75 | -0.04% | 333 327.03 | 16 012.16 | 4.80% |
| 31.07.2015 | 349 461.94 | 348 617.28 | 844.66 | 0.24% | 333 024.31 | 16 437.63 | 4.94% |
| 30.06.2015 | 348 617.28 | 329 088.80 | 19 528.48 | 5.93% | 332 164.70 | 16 452.58 | 4.95% |
| 31.05.2015 | 329 088.80 | 327 763.78 | 1 325.02 | 0.40% | 332 225.90 | -3 137.10 | -0.94% |
| 30.04.2015 | 327 763.78 | 328 616.56 | - 852.78 | -0.26% | 331 507.55 | -3 743.77 | -1.13% |
| 31.03.2015 | 328 616.56 | 327 795.62 | 820.94 | 0.25% | 333 305.99 | -4 689.43 | -1.41% |
| 28.02.2015 | 327 795.62 | 328 573.26 | - 777.64 | -0.24% | 332 438.44 | -4 642.82 | -1.40% |
| 31.01.2015 | 328 573.26 | 330 440.05 | -1 866.79 | -0.56% | 333 039.49 | -4 466.23 | -1.34% |
| 31.12.2014 | 330 440.05 | 329 311.54 | 1 128.51 | 0.34% | 335 415.13 | -4 975.08 | -1.48% |
| 30.11.2014 | 329 311.54 | 329 661.24 | - 349.70 | -0.11% | 336 940.64 | -7 629.10 | -2.26% |
| 31.10.2014 | 329 661.24 | 333 931.51 | -4 270.27 | -1.28% | 333 499.15 | -3 837.91 | -1.15% |
| 30.09.2014 | 333 931.51 | 333 327.03 | 604.48 | 0.18% | 332 339.55 | 1 591.96 | 0.48% |
| 31.08.2014 | 333 327.03 | 333 024.31 | 302.72 | 0.09% | 331 400.21 | 1 926.82 | 0.58% |
| 31.07.2014 | 333 024.31 | 332 164.70 | 859.61 | 0.26% | 330 785.32 | 2 238.99 | 0.68% |
| 30.06.2014 | 332 164.70 | 332 225.90 | -61.20 | -0.02% | 328 728.74 | 3 435.96 | 1.05% |
| 31.05.2014 | 332 225.90 | 331 507.55 | 718.35 | 0.22% | 329 111.95 | 3 113.95 | 0.95% |
| 30.04.2014 | 331 507.55 | 333 305.99 | -1 798.44 | -0.54% | 326 402.77 | 5 104.78 | 1.56% |
| 31.03.2014 | 333 305.99 | 332 438.44 | 867.55 | 0.26% | 326 505.64 | 6 800.35 | 2.08% |
| 28.02.2014 | 332 438.44 | 333 039.49 | - 601.05 | -0.18% | 325 684.79 | 6 753.65 | 2.07% |
| 31.01.2014 | 333 039.49 | 335 415.13 | -2 375.64 | -0.71% | 327 321.00 | 5 718.49 | 1.75% |
| 31.12.2013 | 335 415.13 | 336 940.64 | -1 525.51 | -0.45% | 330 901.84 | 4 513.29 | 1.36% |
| 30.11.2013 | 336 940.64 | 333 499.15 | 3 441.49 | 1.03% | 329 965.47 | 6 975.17 | 2.11% |
| 31.10.2013 | 333 499.15 | 332 339.55 | 1 159.60 | 0.35% | 330 118.07 | 3 381.08 | 1.02% |
| 30.09.2013 | 332 339.55 | 331 400.21 | 939.34 | 0.28% | 329 126.66 | 3 212.89 | 0.98% |
| 31.08.2013 | 331 400.21 | 330 785.32 | 614.89 | 0.19% | 328 862.26 | 2 537.95 | 0.77% |
| 31.07.2013 | 330 785.32 | 328 728.74 | 2 056.58 | 0.63% | 329 308.01 | 1 477.31 | 0.45% |
| 30.06.2013 | 328 728.74 | 329 111.95 | - 383.21 | -0.12% | 327 819.27 | 909.47 | 0.28% |
| 31.05.2013 | 329 111.95 | 326 402.77 | 2 709.18 | 0.83% | 327 682.01 | 1 429.94 | 0.44% |
| 30.04.2013 | 326 402.77 | 326 505.64 | - 102.87 | -0.03% | 327 593.43 | -1 190.66 | -0.36% |
| 31.03.2013 | 326 505.64 | 325 684.79 | 820.85 | 0.25% | 328 182.07 | -1 676.43 | -0.51% |
| 28.02.2013 | 325 684.79 | 327 321.00 | -1 636.21 | -0.50% | 327 676.84 | -1 992.05 | -0.61% |
| 31.01.2013 | 327 321.00 | 330 901.84 | -3 580.84 | -1.08% | 327 956.50 | - 635.50 | -0.19% |
| 31.12.2012 | 330 901.84 | 329 965.47 | 936.37 | 0.28% | 329 601.27 | 1 300.57 | 0.39% |
| 30.11.2012 | 329 965.47 | 330 118.07 | - 152.60 | -0.05% | 329 527.41 | 438.06 | 0.13% |
| 31.10.2012 | 330 118.07 | 329 126.66 | 991.41 | 0.30% | 328 348.48 | 1 769.59 | 0.54% |
| 30.09.2012 | 329 126.66 | 328 862.26 | 264.40 | 0.08% | 327 587.56 | 1 539.10 | 0.47% |
| 31.08.2012 | 328 862.26 | 329 308.01 | - 445.75 | -0.14% | 326 991.84 | 1 870.42 | 0.57% |
| 31.07.2012 | 329 308.01 | 327 819.27 | 1 488.74 | 0.45% | 325 647.39 | 3 660.62 | 1.12% |
| 30.06.2012 | 327 819.27 | 327 682.01 | 137.26 | 0.04% | 324 105.98 | 3 713.29 | 1.15% |
| 31.05.2012 | 327 682.01 | 327 593.43 | 88.58 | 0.03% | 322 818.93 | 4 863.08 | 1.51% |
| 30.04.2012 | 327 593.43 | 328 182.07 | - 588.64 | -0.18% | 321 600.67 | 5 992.76 | 1.86% |
| 31.03.2012 | 328 182.07 | 327 676.84 | 505.23 | 0.15% | 322 689.50 | 5 492.57 | 1.70% |
| 29.02.2012 | 327 676.84 | 327 956.50 | - 279.66 | -0.09% | 315 278.69 | 12 398.15 | 3.93% |
| 31.01.2012 | 327 956.50 | 329 601.27 | -1 644.77 | -0.50% | 315 580.19 | 12 376.31 | 3.92% |
| 31.12.2011 | 329 601.27 | 329 527.41 | 73.86 | 0.02% | 318 568.55 | 11 032.72 | 3.46% |
| 30.11.2011 | 329 527.41 | 328 348.48 | 1 178.93 | 0.36% | 318 158.19 | 11 369.22 | 3.57% |
| 31.10.2011 | 328 348.48 | 327 587.56 | 760.92 | 0.23% | 316 591.68 | 11 756.80 | 3.71% |
| 30.09.2011 | 327 587.56 | 326 991.84 | 595.72 | 0.18% | 315 366.06 | 12 221.50 | 3.88% |
| 31.08.2011 | 326 991.84 | 325 647.39 | 1 344.45 | 0.41% | 303 148.14 | 23 843.70 | 7.87% |
| 31.07.2011 | 325 647.39 | 324 105.98 | 1 541.41 | 0.48% | 302 425.03 | 23 222.36 | 7.68% |
| 30.06.2011 | 324 105.98 | 322 818.93 | 1 287.05 | 0.40% | 300 328.65 | 23 777.33 | 7.92% |
| 31.05.2011 | 322 818.93 | 321 600.67 | 1 218.26 | 0.38% | 298 455.79 | 24 363.14 | 8.16% |
| 30.04.2011 | 321 600.67 | 322 689.50 | -1 088.83 | -0.34% | 295 952.77 | 25 647.90 | 8.67% |
| 31.03.2011 | 322 689.50 | 315 278.69 | 7 410.81 | 2.35% | 295 690.13 | 26 999.37 | 9.13% |
| 28.02.2011 | 315 278.69 | 315 580.19 | - 301.50 | -0.10% | 293 632.57 | 21 646.12 | 7.37% |
| 31.01.2011 | 315 580.19 | 318 568.55 | -2 988.36 | -0.94% | 293 427.88 | 22 152.31 | 7.55% |
| 31.12.2010 | 318 568.55 | 318 158.19 | 410.36 | 0.13% | 291 979.51 | 26 589.04 | 9.11% |
| 30.11.2010 | 318 158.19 | 316 591.68 | 1 566.51 | 0.49% | 289 896.65 | 28 261.54 | 9.75% |
| 31.10.2010 | 316 591.68 | 315 366.06 | 1 225.62 | 0.39% | 289 570.25 | 27 021.43 | 9.33% |
| 30.09.2010 | 315 366.06 | 303 148.14 | 12 217.92 | 4.03% | 287 534.88 | 27 831.18 | 9.68% |
| 31.08.2010 | 303 148.14 | 302 425.03 | 723.11 | 0.24% | 285 526.87 | 17 621.27 | 6.17% |
| 31.07.2010 | 302 425.03 | 300 328.65 | 2 096.38 | 0.70% | 283 447.64 | 18 977.39 | 6.70% |
| 30.06.2010 | 300 328.65 | 298 455.79 | 1 872.86 | 0.63% | 280 213.95 | 20 114.70 | 7.18% |
| 31.05.2010 | 298 455.79 | 295 952.77 | 2 503.02 | 0.85% | 276 920.19 | 21 535.60 | 7.78% |
| 30.04.2010 | 295 952.77 | 295 690.13 | 262.64 | 0.09% | 275 177.40 | 20 775.37 | 7.55% |
| 31.03.2010 | 295 690.13 | 293 632.57 | 2 057.56 | 0.70% | 272 549.16 | 23 140.97 | 8.49% |
| 28.02.2010 | 293 632.57 | 293 427.88 | 204.69 | 0.07% | 268 535.15 | 25 097.42 | 9.35% |
| 31.01.2010 | 293 427.88 | 291 979.51 | 1 448.37 | 0.50% | 261 097.73 | 32 330.15 | 12.38% |
| 31.12.2009 | 291 979.51 | 289 896.65 | 2 082.86 | 0.72% | 260 972.95 | 31 006.56 | 11.88% |
| 30.11.2009 | 289 896.65 | 289 570.25 | 326.40 | 0.11% | 253 296.05 | 36 600.60 | 14.45% |
| 31.10.2009 | 289 570.25 | 287 534.88 | 2 035.37 | 0.71% | 250 201.39 | 39 368.86 | 15.73% |
| 30.09.2009 | 287 534.88 | 285 526.87 | 2 008.01 | 0.70% | 248 559.97 | 38 974.91 | 15.68% |
| 31.08.2009 | 285 526.87 | 283 447.64 | 2 079.23 | 0.73% | 243 863.78 | 41 663.09 | 17.08% |
| 31.07.2009 | 283 447.64 | 280 213.95 | 3 233.69 | 1.15% | 240 585.76 | 42 861.88 | 17.82% |
| 30.06.2009 | 280 213.95 | 276 920.19 | 3 293.76 | 1.19% | 235 478.11 | 44 735.84 | 19.00% |
| 31.05.2009 | 276 920.19 | 275 177.40 | 1 742.79 | 0.63% | 230 149.19 | 46 771.00 | 20.32% |
| 30.04.2009 | 275 177.40 | 272 549.16 | 2 628.24 | 0.96% | 224 924.63 | 50 252.77 | 22.34% |
| 31.03.2009 | 272 549.16 | 268 535.15 | 4 014.01 | 1.49% | 220 515.78 | 52 033.38 | 23.60% |
| 28.02.2009 | 268 535.15 | 261 097.73 | 7 437.42 | 2.85% | 215 710.42 | 52 824.73 | 24.49% |
| 31.01.2009 | 261 097.73 | 260 972.95 | 124.78 | 0.05% | 212 812.24 | 48 285.49 | 22.69% |
| 31.12.2008 | 260 972.95 | 253 296.05 | 7 676.90 | 3.03% | 210 784.42 | 50 188.53 | 23.81% |
| 30.11.2008 | 253 296.05 | 250 201.39 | 3 094.66 | 1.24% | 206 692.65 | 46 603.40 | 22.55% |
| 31.10.2008 | 250 201.39 | 248 559.97 | 1 641.42 | 0.66% | 202 114.56 | 48 086.83 | 23.79% |
| 30.09.2008 | 248 559.97 | 243 863.78 | 4 696.19 | 1.93% | 197 978.96 | 50 581.01 | 25.55% |
| 31.08.2008 | 243 863.78 | 240 585.76 | 3 278.02 | 1.36% | 194 399.42 | 49 464.36 | 25.44% |
| 31.07.2008 | 240 585.76 | 235 478.11 | 5 107.65 | 2.17% | 190 565.97 | 50 019.79 | 26.25% |
| 30.06.2008 | 235 478.11 | 230 149.19 | 5 328.92 | 2.32% | 186 587.08 | 48 891.03 | 26.20% |
| 31.05.2008 | 230 149.19 | 224 924.63 | 5 224.56 | 2.32% | 182 102.64 | 48 046.55 | 26.38% |
| 30.04.2008 | 224 924.63 | 220 515.78 | 4 408.85 | 2.00% | 177 714.24 | 47 210.39 | 26.57% |
| 31.03.2008 | 220 515.78 | 215 710.42 | 4 805.36 | 2.23% | 174 613.45 | 45 902.33 | 26.29% |
| 29.02.2008 | 215 710.42 | 212 812.24 | 2 898.18 | 1.36% | 169 855.18 | 45 855.24 | 27.00% |
| 31.01.2008 | 212 812.24 | 210 784.42 | 2 027.82 | 0.96% | 167 637.38 | 45 174.86 | 26.95% |
| 31.12.2007 | 210 784.42 | 206 692.65 | 4 091.77 | 1.98% | 165 361.06 | 45 423.36 | 27.47% |
| 30.11.2007 | 206 692.65 | 202 114.56 | 4 578.09 | 2.27% | 160 061.45 | 46 631.20 | 29.13% |
| 31.10.2007 | 202 114.56 | 197 978.96 | 4 135.60 | 2.09% | 157 148.41 | 44 966.15 | 28.61% |
| 30.09.2007 | 197 978.96 | 194 399.42 | 3 579.54 | 1.84% | 155 934.78 | 42 044.18 | 26.96% |
| 31.08.2007 | 194 399.42 | 190 565.97 | 3 833.45 | 2.01% | 152 227.83 | 42 171.59 | 27.70% |
| 31.07.2007 | 190 565.97 | 186 587.08 | 3 978.89 | 2.13% | 150 097.12 | 40 468.85 | 26.96% |
| 30.06.2007 | 186 587.08 | 182 102.64 | 4 484.44 | 2.46% | 146 845.72 | 39 741.36 | 27.06% |
| 31.05.2007 | 182 102.64 | 177 714.24 | 4 388.40 | 2.47% | 143 694.95 | 38 407.69 | 26.73% |
| 30.04.2007 | 177 714.24 | 174 613.45 | 3 100.79 | 1.78% | 140 517.92 | 37 196.32 | 26.47% |
| 31.03.2007 | 174 613.45 | 169 855.18 | 4 758.27 | 2.80% | 138 778.17 | 35 835.28 | 25.82% |
| 28.02.2007 | 169 855.18 | 167 637.38 | 2 217.80 | 1.32% | 135 285.51 | 34 569.67 | 25.55% |
| 31.01.2007 | 167 637.38 | 165 361.06 | 2 276.32 | 1.38% | 134 742.42 | 32 894.96 | 24.41% |
| 31.12.2006 | 165 361.06 | 160 061.45 | 5 299.61 | 3.31% | 134 757.97 | 30 603.09 | 22.71% |
| 30.11.2006 | 160 061.45 | 157 148.41 | 2 913.04 | 1.85% | 128 302.28 | 31 759.17 | 24.75% |
| 31.10.2006 | 157 148.41 | 155 934.78 | 1 213.63 | 0.78% | 124 289.61 | 32 858.80 | 26.44% |
| 30.09.2006 | 155 934.78 | 152 227.83 | 3 706.95 | 2.44% | 120 359.57 | 35 575.21 | 29.56% |
| 31.08.2006 | 152 227.83 | 150 097.12 | 2 130.71 | 1.42% | 117 972.74 | 34 255.09 | 29.04% |
| 31.07.2006 | 150 097.12 | 146 845.72 | 3 251.40 | 2.21% | 115 997.10 | 34 100.02 | 29.40% |
| 30.06.2006 | 146 845.72 | 143 694.95 | 3 150.77 | 2.19% | 114 321.39 | 32 524.33 | 28.45% |
| 31.05.2006 | 143 694.95 | 140 517.92 | 3 177.03 | 2.26% | 111 450.81 | 32 244.14 | 28.93% |
| 30.04.2006 | 140 517.92 | 138 778.17 | 1 739.75 | 1.25% | 108 678.39 | 31 839.53 | 29.30% |
| 31.03.2006 | 138 778.17 | 135 285.51 | 3 492.66 | 2.58% | 106 567.36 | 32 210.81 | 30.23% |
| 28.02.2006 | 135 285.51 | 134 742.42 | 543.09 | 0.40% | 103 821.15 | 31 464.36 | 30.31% |
| 31.01.2006 | 134 742.42 | 134 757.97 | -15.55 | -0.01% | 103 660.01 | 31 082.41 | 29.98% |
| 31.12.2005 | 134 757.97 | 128 302.28 | 6 455.69 | 5.03% | 104 591.19 | 30 166.78 | 28.84% |
| 30.11.2005 | 128 302.28 | 124 289.61 | 4 012.67 | 3.23% | 98 657.70 | 29 644.58 | 30.05% |
| 31.10.2005 | 124 289.61 | 120 359.57 | 3 930.04 | 3.27% | 96 589.51 | 27 700.10 | 28.68% |
| 30.09.2005 | 120 359.57 | 117 972.74 | 2 386.83 | 2.02% | 94 090.44 | 26 269.13 | 27.92% |
| 31.08.2005 | 117 972.74 | 115 997.10 | 1 975.64 | 1.70% | 92 006.06 | 25 966.68 | 28.22% |
| 31.07.2005 | 115 997.10 | 114 321.39 | 1 675.71 | 1.47% | 90 720.30 | 25 276.80 | 27.86% |
| 30.06.2005 | 114 321.39 | 111 450.81 | 2 870.58 | 2.58% | 89 147.63 | 25 173.76 | 28.24% |
| 31.05.2005 | 111 450.81 | 108 678.39 | 2 772.42 | 2.55% | 86 619.30 | 24 831.51 | 28.67% |
| 30.04.2005 | 108 678.39 | 106 567.36 | 2 111.03 | 1.98% | 84 560.54 | 24 117.85 | 28.52% |
| 31.03.2005 | 106 567.36 | 103 821.15 | 2 746.21 | 2.65% | 80 453.78 | 26 113.58 | 32.46% |
| 28.02.2005 | 103 821.15 | 103 660.01 | 161.14 | 0.16% | 81 378.25 | 22 442.90 | 27.58% |
| 31.01.2005 | 103 660.01 | 104 591.19 | - 931.18 | -0.89% | 81 021.36 | 22 638.65 | 27.94% |
| 31.12.2004 | 104 591.19 | 98 657.70 | 5 933.49 | 6.01% | 81 269.44 | 23 321.75 | 28.70% |
| 30.11.2004 | 98 657.70 | 96 589.51 | 2 068.19 | 2.14% | 76 274.42 | 22 383.28 | 29.35% |
| 31.10.2004 | 96 589.51 | 94 090.44 | 2 499.07 | 2.66% | 77 059.14 | 19 530.37 | 25.34% |
| 30.09.2004 | 94 090.44 | 92 006.06 | 2 084.38 | 2.27% | 72 752.06 | 21 338.38 | 29.33% |
| 31.08.2004 | 92 006.06 | 90 720.30 | 1 285.76 | 1.42% | 75 308.29 | 16 697.77 | 22.17% |
| 31.07.2004 | 90 720.30 | 89 147.63 | 1 572.67 | 1.76% | 73 866.39 | 16 853.91 | 22.82% |
| 30.06.2004 | 89 147.63 | 86 619.30 | 2 528.33 | 2.92% | 73 470.61 | 15 677.02 | 21.34% |
| 31.05.2004 | 86 619.30 | 84 560.54 | 2 058.76 | 2.43% | 72 496.51 | 14 122.79 | 19.48% |
| 30.04.2004 | 84 560.54 | 80 453.78 | 4 106.76 | 5.10% | 72 317.97 | 12 242.57 | 16.93% |
| 31.03.2004 | 80 453.78 | 81 378.25 | - 924.47 | -1.14% | 71 377.37 | 9 076.41 | 12.72% |
| 29.02.2004 | 81 378.25 | 81 021.36 | 356.89 | 0.44% | 70 389.52 | 10 988.73 | 15.61% |
| 31.01.2004 | 81 021.36 | 81 269.44 | - 248.08 | -0.31% | 69 840.02 | 11 181.34 | 16.01% |
| 31.12.2003 | 81 269.44 | 76 274.42 | 4 995.02 | 6.55% | 68 471.82 | 12 797.62 | 18.69% |
| 30.11.2003 | 76 274.42 | 77 059.14 | - 784.72 | -1.02% | 65 531.84 | 10 742.58 | 16.39% |
| 31.10.2003 | 77 059.14 | 72 752.06 | 4 307.08 | 5.92% | 63 483.15 | 13 575.99 | 21.39% |
| 30.09.2003 | 72 752.06 | 75 308.29 | -2 556.23 | -3.39% | 62 926.20 | 9 825.86 | 15.61% |
| 31.08.2003 | 75 308.29 | 73 866.39 | 1 441.90 | 1.95% | 59 316.76 | 15 991.53 | 26.96% |
| 31.07.2003 | 73 866.39 | 73 470.61 | 395.78 | 0.54% | 58 560.51 | 15 305.88 | 26.14% |
| 30.06.2003 | 73 470.61 | 72 496.51 | 974.10 | 1.34% | 58 336.21 | 15 134.40 | 25.94% |
| 31.05.2003 | 72 496.51 | 72 317.97 | 178.54 | 0.25% | 56 576.42 | 15 920.09 | 28.14% |
| 30.04.2003 | 72 317.97 | 71 377.37 | 940.60 | 1.32% | 59 151.91 | 13 166.06 | 22.26% |
| 31.03.2003 | 71 377.37 | 70 389.52 | 987.85 | 1.40% | 57 200.77 | 14 176.60 | 24.78% |
| 28.02.2003 | 70 389.52 | 69 840.02 | 549.50 | 0.79% | 57 807.67 | 12 581.85 | 21.77% |
| 31.01.2003 | 69 840.02 | 68 471.82 | 1 368.20 | 2.00% | 58 982.73 | 10 857.29 | 18.41% |
| 31.12.2002 | 68 471.82 | 65 531.84 | 2 939.98 | 4.49% | - | - | - |
| 30.11.2002 | 65 531.84 | 63 483.15 | 2 048.69 | 3.23% | - | - | - |
| 31.10.2002 | 63 483.15 | 62 926.20 | 556.95 | 0.89% | - | - | - |
| 30.09.2002 | 62 926.20 | 59 316.76 | 3 609.44 | 6.08% | - | - | - |
| 31.08.2002 | 59 316.76 | 58 560.51 | 756.25 | 1.29% | - | - | - |
| 31.07.2002 | 58 560.51 | 58 336.21 | 224.30 | 0.38% | - | - | - |
| 30.06.2002 | 58 336.21 | 56 576.42 | 1 759.79 | 3.11% | - | - | - |
| 31.05.2002 | 56 576.42 | 59 151.91 | -2 575.49 | -4.35% | - | - | - |
| 30.04.2002 | 59 151.91 | 57 200.77 | 1 951.14 | 3.41% | - | - | - |
| 31.03.2002 | 57 200.77 | 57 807.67 | - 606.90 | -1.05% | - | - | - |
| 28.02.2002 | 57 807.67 | 58 982.73 | -1 175.06 | -1.99% | - | - | - |
| 31.01.2002 | 58 982.73 | - | - | - | - | - | - |
Graf jako obrázek

Podobné sestavy
Aplikace Ekonomika ČNB ze sekce makroekonomika zobrazuje časové řady hlavních makroekonomických údajů z ekonomiky ČR. Najdete zde přes 10.000 grafů různých hodnot od úrokových sazeb, přes statistiky státního rozpočtu, statistiky ČNB a data zpracovávaná ČSÚ. Data jsou k dispozici obvykle za posledních více než 20 let, od prosince roku 1992. Zdroj dat: ČNB ARAD

