Profit or (-) loss after tax from discontinued operations - ekonomika ČNB
Aktualizace dat Profit or (-) loss after tax from discontinued operations v této aplikaci skončila 30.6.2023. Aktualizovná data časových řad najdete na stránkách nové aplikace z dat ARAD ČNB
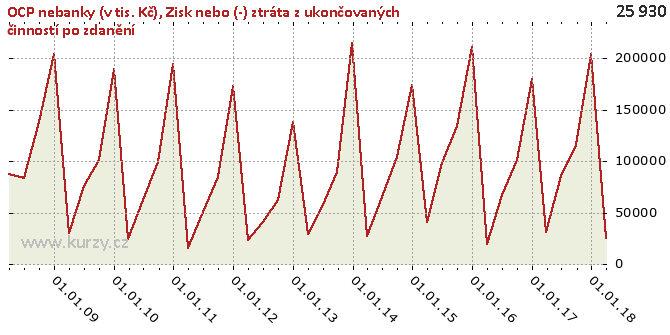
Graf hodnot, Investment firms - non-banks (in CZK thousands)
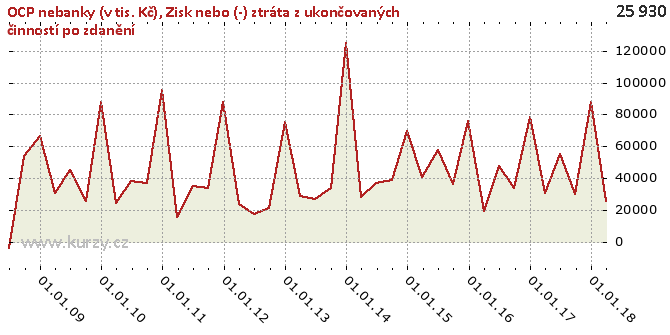
Přepočtený graf hodnot
Časová řada Profit or (-) loss after tax from discontinued operations obsahuje kumulované roční údaje. Následující graf hodnot zobrazuje přepočtená rozdílová data.
Meziroční srovnání
Minima a maxima
| Typ | Období | Hodnota |
|---|---|---|
| Max | 31.12.2013 | 214 819.00 |
| Min | 31.03.2011 | 15 448.00 |
Historické hodnoty
| Období | Hodnota | Předchozí | Rozdíl | Změna | Před rokem | Rozdíl | Změna |
|---|---|---|---|---|---|---|---|
| 31.03.2018 | 25 930.00 | 203 549.00 | - 177 619.00 | -87.26% | 30 984.00 | -5 054.00 | -16.31% |
| 31.12.2017 | 203 549.00 | 115 980.00 | 87 569.00 | 75.50% | 179 728.00 | 23 821.00 | 13.25% |
| 30.09.2017 | 115 980.00 | 85 857.00 | 30 123.00 | 35.09% | 101 024.00 | 14 956.00 | 14.80% |
| 30.06.2017 | 85 857.00 | 30 984.00 | 54 873.00 | 177.10% | 66 987.00 | 18 870.00 | 28.17% |
| 31.03.2017 | 30 984.00 | 179 728.00 | - 148 744.00 | -82.76% | 19 283.00 | 11 701.00 | 60.68% |
| 31.12.2016 | 179 728.00 | 101 024.00 | 78 704.00 | 77.91% | 210 333.00 | -30 605.00 | -14.55% |
| 30.09.2016 | 101 024.00 | 66 987.00 | 34 037.00 | 50.81% | 134 465.00 | -33 441.00 | -24.87% |
| 30.06.2016 | 66 987.00 | 19 283.00 | 47 704.00 | 247.39% | 98 214.00 | -31 227.00 | -31.79% |
| 31.03.2016 | 19 283.00 | 210 333.00 | - 191 050.00 | -90.83% | 40 793.00 | -21 510.00 | -52.73% |
| 31.12.2015 | 210 333.00 | 134 465.00 | 75 868.00 | 56.42% | 173 256.00 | 37 077.00 | 21.40% |
| 30.09.2015 | 134 465.00 | 98 214.00 | 36 251.00 | 36.91% | 103 888.00 | 30 577.00 | 29.43% |
| 30.06.2015 | 98 214.00 | 40 793.00 | 57 421.00 | 140.76% | 65 035.00 | 33 179.00 | 51.02% |
| 31.03.2015 | 40 793.00 | 173 256.00 | - 132 463.00 | -76.45% | 27 915.00 | 12 878.00 | 46.13% |
| 31.12.2014 | 173 256.00 | 103 888.00 | 69 368.00 | 66.77% | 214 819.00 | -41 563.00 | -19.35% |
| 30.09.2014 | 103 888.00 | 65 035.00 | 38 853.00 | 59.74% | 89 657.00 | 14 231.00 | 15.87% |
| 30.06.2014 | 65 035.00 | 27 915.00 | 37 120.00 | 132.98% | 56 039.00 | 8 996.00 | 16.05% |
| 31.03.2014 | 27 915.00 | 214 819.00 | - 186 904.00 | -87.01% | 29 012.00 | -1 097.00 | -3.78% |
| 31.12.2013 | 214 819.00 | 89 657.00 | 125 162.00 | 139.60% | 137 805.00 | 77 014.00 | 55.89% |
| 30.09.2013 | 89 657.00 | 56 039.00 | 33 618.00 | 59.99% | 62 782.00 | 26 875.00 | 42.81% |
| 30.06.2013 | 56 039.00 | 29 012.00 | 27 027.00 | 93.16% | 41 278.00 | 14 761.00 | 35.76% |
| 31.03.2013 | 29 012.00 | 137 805.00 | - 108 793.00 | -78.95% | 23 544.00 | 5 468.00 | 23.22% |
| 31.12.2012 | 137 805.00 | 62 782.00 | 75 023.00 | 119.50% | 172 297.00 | -34 492.00 | -20.02% |
| 30.09.2012 | 62 782.00 | 41 278.00 | 21 504.00 | 52.10% | 84 684.00 | -21 902.00 | -25.86% |
| 30.06.2012 | 41 278.00 | 23 544.00 | 17 734.00 | 75.32% | 50 612.00 | -9 334.00 | -18.44% |
| 31.03.2012 | 23 544.00 | 172 297.00 | - 148 753.00 | -86.34% | 15 448.00 | 8 096.00 | 52.41% |
| 31.12.2011 | 172 297.00 | 84 684.00 | 87 613.00 | 103.46% | 194 333.00 | -22 036.00 | -11.34% |
| 30.09.2011 | 84 684.00 | 50 612.00 | 34 072.00 | 67.32% | 99 145.00 | -14 461.00 | -14.59% |
| 30.06.2011 | 50 612.00 | 15 448.00 | 35 164.00 | 227.63% | 62 464.00 | -11 852.00 | -18.97% |
| 31.03.2011 | 15 448.00 | 194 333.00 | - 178 885.00 | -92.05% | 24 312.00 | -8 864.00 | -36.46% |
| 31.12.2010 | 194 333.00 | 99 145.00 | 95 188.00 | 96.01% | 189 548.00 | 4 785.00 | 2.52% |
| 30.09.2010 | 99 145.00 | 62 464.00 | 36 681.00 | 58.72% | 101 554.00 | -2 409.00 | -2.37% |
| 30.06.2010 | 62 464.00 | 24 312.00 | 38 152.00 | 156.93% | 75 878.00 | -13 414.00 | -17.68% |
| 31.03.2010 | 24 312.00 | 189 548.00 | - 165 236.00 | -87.17% | 30 520.00 | -6 208.00 | -20.34% |
| 31.12.2009 | 189 548.00 | 101 554.00 | 87 994.00 | 86.65% | 203 643.00 | -14 095.00 | -6.92% |
| 30.09.2009 | 101 554.00 | 75 878.00 | 25 676.00 | 33.84% | 137 443.00 | -35 889.00 | -26.11% |
| 30.06.2009 | 75 878.00 | 30 520.00 | 45 358.00 | 148.62% | 83 644.00 | -7 766.00 | -9.28% |
| 31.03.2009 | 30 520.00 | 203 643.00 | - 173 123.00 | -85.01% | 87 768.00 | -57 248.00 | -65.23% |
| 31.12.2008 | 203 643.00 | 137 443.00 | 66 200.00 | 48.17% | - | - | - |
| 30.09.2008 | 137 443.00 | 83 644.00 | 53 799.00 | 64.32% | - | - | - |
| 30.06.2008 | 83 644.00 | 87 768.00 | -4 124.00 | -4.70% | - | - | - |
| 31.03.2008 | 87 768.00 | - | - | - | - | - | - |
Graf jako obrázek


Podobné sestavy
Aplikace Ekonomika ČNB ze sekce makroekonomika zobrazuje časové řady hlavních makroekonomických údajů z ekonomiky ČR. Najdete zde přes 10.000 grafů různých hodnot od úrokových sazeb, přes statistiky státního rozpočtu, statistiky ČNB a data zpracovávaná ČSÚ. Data jsou k dispozici obvykle za posledních více než 20 let, od prosince roku 1992. Zdroj dat: ČNB ARAD

