Profit or (-) loss after tax from discontinued operations - ekonomika ČNB
Aktualizace dat Profit or (-) loss after tax from discontinued operations v této aplikaci skončila 30.6.2023. Aktualizovná data časových řad najdete na stránkách nové aplikace z dat ARAD ČNB
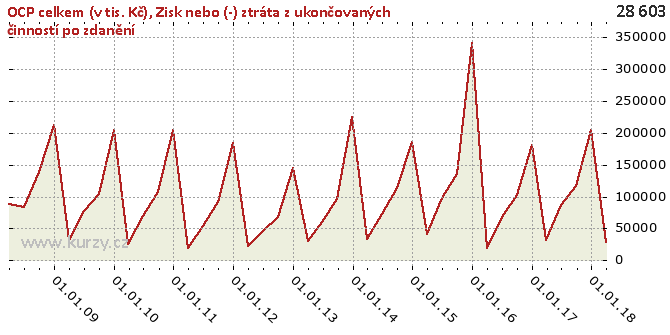
Graf hodnot, Investment firms total (in CZK thousands)
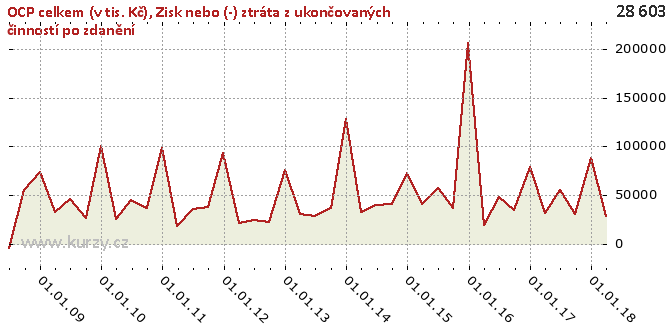
Přepočtený graf hodnot
Časová řada Profit or (-) loss after tax from discontinued operations obsahuje kumulované roční údaje. Následující graf hodnot zobrazuje přepočtená rozdílová data.
Meziroční srovnání
Minima a maxima
| Typ | Období | Hodnota |
|---|---|---|
| Max | 31.12.2015 | 341 945.00 |
| Min | 31.03.2011 | 18 407.00 |
Historické hodnoty
| Období | Hodnota | Předchozí | Rozdíl | Změna | Před rokem | Rozdíl | Změna |
|---|---|---|---|---|---|---|---|
| 31.03.2018 | 28 603.00 | 205 139.00 | - 176 536.00 | -86.06% | 31 518.00 | -2 915.00 | -9.25% |
| 31.12.2017 | 205 139.00 | 116 950.00 | 88 189.00 | 75.41% | 180 748.00 | 24 391.00 | 13.49% |
| 30.09.2017 | 116 950.00 | 86 737.00 | 30 213.00 | 34.83% | 102 207.00 | 14 743.00 | 14.42% |
| 30.06.2017 | 86 737.00 | 31 518.00 | 55 219.00 | 175.20% | 67 879.00 | 18 858.00 | 27.78% |
| 31.03.2017 | 31 518.00 | 180 748.00 | - 149 230.00 | -82.56% | 19 577.00 | 11 941.00 | 60.99% |
| 31.12.2016 | 180 748.00 | 102 207.00 | 78 541.00 | 76.84% | 341 945.00 | - 161 197.00 | -47.14% |
| 30.09.2016 | 102 207.00 | 67 879.00 | 34 328.00 | 50.57% | 135 210.00 | -33 003.00 | -24.41% |
| 30.06.2016 | 67 879.00 | 19 577.00 | 48 302.00 | 246.73% | 98 252.00 | -30 373.00 | -30.91% |
| 31.03.2016 | 19 577.00 | 341 945.00 | - 322 368.00 | -94.27% | 40 953.00 | -21 376.00 | -52.20% |
| 31.12.2015 | 341 945.00 | 135 210.00 | 206 735.00 | 152.90% | 186 070.00 | 155 875.00 | 83.77% |
| 30.09.2015 | 135 210.00 | 98 252.00 | 36 958.00 | 37.62% | 113 357.00 | 21 853.00 | 19.28% |
| 30.06.2015 | 98 252.00 | 40 953.00 | 57 299.00 | 139.91% | 72 710.00 | 25 542.00 | 35.13% |
| 31.03.2015 | 40 953.00 | 186 070.00 | - 145 117.00 | -77.99% | 32 572.00 | 8 381.00 | 25.73% |
| 31.12.2014 | 186 070.00 | 113 357.00 | 72 713.00 | 64.15% | 224 811.00 | -38 741.00 | -17.23% |
| 30.09.2014 | 113 357.00 | 72 710.00 | 40 647.00 | 55.90% | 96 548.00 | 16 809.00 | 17.41% |
| 30.06.2014 | 72 710.00 | 32 572.00 | 40 138.00 | 123.23% | 59 428.00 | 13 282.00 | 22.35% |
| 31.03.2014 | 32 572.00 | 224 811.00 | - 192 239.00 | -85.51% | 30 542.00 | 2 030.00 | 6.65% |
| 31.12.2013 | 224 811.00 | 96 548.00 | 128 263.00 | 132.85% | 144 485.00 | 80 326.00 | 55.59% |
| 30.09.2013 | 96 548.00 | 59 428.00 | 37 120.00 | 62.46% | 68 273.00 | 28 275.00 | 41.41% |
| 30.06.2013 | 59 428.00 | 30 542.00 | 28 886.00 | 94.58% | 46 146.00 | 13 282.00 | 28.78% |
| 31.03.2013 | 30 542.00 | 144 485.00 | - 113 943.00 | -78.86% | 21 635.00 | 8 907.00 | 41.17% |
| 31.12.2012 | 144 485.00 | 68 273.00 | 76 212.00 | 111.63% | 184 228.00 | -39 743.00 | -21.57% |
| 30.09.2012 | 68 273.00 | 46 146.00 | 22 127.00 | 47.95% | 91 219.00 | -22 946.00 | -25.15% |
| 30.06.2012 | 46 146.00 | 21 635.00 | 24 511.00 | 113.29% | 53 838.00 | -7 692.00 | -14.29% |
| 31.03.2012 | 21 635.00 | 184 228.00 | - 162 593.00 | -88.26% | 18 407.00 | 3 228.00 | 17.54% |
| 31.12.2011 | 184 228.00 | 91 219.00 | 93 009.00 | 101.96% | 204 689.00 | -20 461.00 | -10.00% |
| 30.09.2011 | 91 219.00 | 53 838.00 | 37 381.00 | 69.43% | 106 620.00 | -15 401.00 | -14.44% |
| 30.06.2011 | 53 838.00 | 18 407.00 | 35 431.00 | 192.49% | 69 604.00 | -15 766.00 | -22.65% |
| 31.03.2011 | 18 407.00 | 204 689.00 | - 186 282.00 | -91.01% | 24 996.00 | -6 589.00 | -26.36% |
| 31.12.2010 | 204 689.00 | 106 620.00 | 98 069.00 | 91.98% | 204 621.00 | 68.00 | 0.03% |
| 30.09.2010 | 106 620.00 | 69 604.00 | 37 016.00 | 53.18% | 104 034.00 | 2 586.00 | 2.49% |
| 30.06.2010 | 69 604.00 | 24 996.00 | 44 608.00 | 178.46% | 77 985.00 | -8 381.00 | -10.75% |
| 31.03.2010 | 24 996.00 | 204 621.00 | - 179 625.00 | -87.78% | 32 331.00 | -7 335.00 | -22.69% |
| 31.12.2009 | 204 621.00 | 104 034.00 | 100 587.00 | 96.69% | 212 584.00 | -7 963.00 | -3.75% |
| 30.09.2009 | 104 034.00 | 77 985.00 | 26 049.00 | 33.40% | 138 716.00 | -34 682.00 | -25.00% |
| 30.06.2009 | 77 985.00 | 32 331.00 | 45 654.00 | 141.21% | 83 861.00 | -5 876.00 | -7.01% |
| 31.03.2009 | 32 331.00 | 212 584.00 | - 180 253.00 | -84.79% | 88 689.00 | -56 358.00 | -63.55% |
| 31.12.2008 | 212 584.00 | 138 716.00 | 73 868.00 | 53.25% | - | - | - |
| 30.09.2008 | 138 716.00 | 83 861.00 | 54 855.00 | 65.41% | - | - | - |
| 30.06.2008 | 83 861.00 | 88 689.00 | -4 828.00 | -5.44% | - | - | - |
| 31.03.2008 | 88 689.00 | - | - | - | - | - | - |
Graf jako obrázek


Podobné sestavy
Aplikace Ekonomika ČNB ze sekce makroekonomika zobrazuje časové řady hlavních makroekonomických údajů z ekonomiky ČR. Najdete zde přes 10.000 grafů různých hodnot od úrokových sazeb, přes statistiky státního rozpočtu, statistiky ČNB a data zpracovávaná ČSÚ. Data jsou k dispozici obvykle za posledních více než 20 let, od prosince roku 1992. Zdroj dat: ČNB ARAD

