Investment fund shares/units (AF.52) (Liabilities, stocks, Total economy) - ekonomika ČNB
Aktualizace dat Investment fund shares/units (AF.52) (Liabilities, stocks, Total economy) v této aplikaci skončila 30.6.2023. Aktualizovná data časových řad najdete na stránkách nové aplikace z dat ARAD ČNB
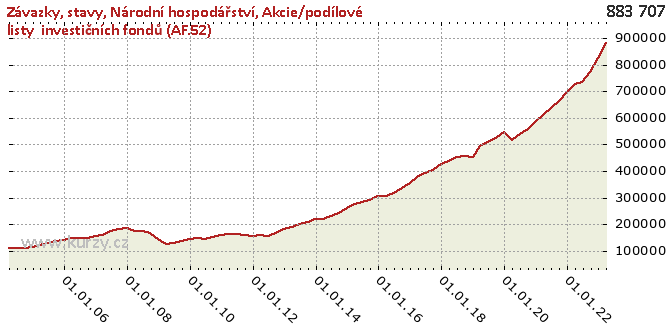
Graf hodnot, Liabilities, stocks, Total economy
Meziroční srovnání
Minima a maxima
| Typ | Období | Hodnota |
|---|---|---|
| Max | 31.12.2019 | 545 135.00 |
| Min | 31.03.2004 | 108 468.00 |
Historické hodnoty
| Období | Hodnota | Předchozí | Rozdíl | Změna | Před rokem | Rozdíl | Změna |
|---|---|---|---|---|---|---|---|
| 31.03.2020 | 516 295.00 | 545 135.00 | -28 840.00 | -5.29% | 495 398.00 | 20 897.00 | 4.22% |
| 31.12.2019 | 545 135.00 | 525 012.00 | 20 123.00 | 3.83% | 452 930.00 | 92 205.00 | 20.36% |
| 30.09.2019 | 525 012.00 | 508 812.00 | 16 200.00 | 3.18% | 457 487.00 | 67 525.00 | 14.76% |
| 30.06.2019 | 508 812.00 | 495 398.00 | 13 414.00 | 2.71% | 451 831.00 | 56 981.00 | 12.61% |
| 31.03.2019 | 495 398.00 | 452 930.00 | 42 468.00 | 9.38% | 437 449.00 | 57 949.00 | 13.25% |
| 31.12.2018 | 452 930.00 | 457 487.00 | -4 557.00 | -1.00% | 426 152.00 | 26 778.00 | 6.28% |
| 30.09.2018 | 457 487.00 | 451 831.00 | 5 656.00 | 1.25% | 405 149.00 | 52 338.00 | 12.92% |
| 30.06.2018 | 451 831.00 | 437 449.00 | 14 382.00 | 3.29% | 391 330.00 | 60 501.00 | 15.46% |
| 31.03.2018 | 437 449.00 | 426 152.00 | 11 297.00 | 2.65% | 376 164.00 | 61 285.00 | 16.29% |
| 31.12.2017 | 426 152.00 | 405 149.00 | 21 003.00 | 5.18% | 355 487.00 | 70 665.00 | 19.88% |
| 30.09.2017 | 405 149.00 | 391 330.00 | 13 819.00 | 3.53% | 336 744.00 | 68 405.00 | 20.31% |
| 30.06.2017 | 391 330.00 | 376 164.00 | 15 166.00 | 4.03% | 316 835.00 | 74 495.00 | 23.51% |
| 31.03.2017 | 376 164.00 | 355 487.00 | 20 677.00 | 5.82% | 307 392.00 | 68 772.00 | 22.37% |
| 31.12.2016 | 355 487.00 | 336 744.00 | 18 743.00 | 5.57% | 307 657.00 | 47 830.00 | 15.55% |
| 30.09.2016 | 336 744.00 | 316 835.00 | 19 909.00 | 6.28% | 289 497.00 | 47 247.00 | 16.32% |
| 30.06.2016 | 316 835.00 | 307 392.00 | 9 443.00 | 3.07% | 283 927.00 | 32 908.00 | 11.59% |
| 31.03.2016 | 307 392.00 | 307 657.00 | - 265.00 | -0.09% | 277 234.00 | 30 158.00 | 10.88% |
| 31.12.2015 | 307 657.00 | 289 497.00 | 18 160.00 | 6.27% | 261 745.00 | 45 912.00 | 17.54% |
| 30.09.2015 | 289 497.00 | 283 927.00 | 5 570.00 | 1.96% | 242 352.00 | 47 145.00 | 19.45% |
| 30.06.2015 | 283 927.00 | 277 234.00 | 6 693.00 | 2.41% | 231 331.00 | 52 596.00 | 22.74% |
| 31.03.2015 | 277 234.00 | 261 745.00 | 15 489.00 | 5.92% | 220 710.00 | 56 524.00 | 25.61% |
| 31.12.2014 | 261 745.00 | 242 352.00 | 19 393.00 | 8.00% | 220 210.00 | 41 535.00 | 18.86% |
| 30.09.2014 | 242 352.00 | 231 331.00 | 11 021.00 | 4.76% | 208 167.00 | 34 185.00 | 16.42% |
| 30.06.2014 | 231 331.00 | 220 710.00 | 10 621.00 | 4.81% | 200 023.00 | 31 308.00 | 15.65% |
| 31.03.2014 | 220 710.00 | 220 210.00 | 500.00 | 0.23% | 188 977.00 | 31 733.00 | 16.79% |
| 31.12.2013 | 220 210.00 | 208 167.00 | 12 043.00 | 5.79% | 182 784.00 | 37 426.00 | 20.48% |
| 30.09.2013 | 208 167.00 | 200 023.00 | 8 144.00 | 4.07% | 166 505.00 | 41 662.00 | 25.02% |
| 30.06.2013 | 200 023.00 | 188 977.00 | 11 046.00 | 5.85% | 156 864.00 | 43 159.00 | 27.51% |
| 31.03.2013 | 188 977.00 | 182 784.00 | 6 193.00 | 3.39% | 158 887.00 | 30 090.00 | 18.94% |
| 31.12.2012 | 182 784.00 | 166 505.00 | 16 279.00 | 9.78% | 156 181.00 | 26 603.00 | 17.03% |
| 30.09.2012 | 166 505.00 | 156 864.00 | 9 641.00 | 6.15% | 158 613.00 | 7 892.00 | 4.98% |
| 30.06.2012 | 156 864.00 | 158 887.00 | -2 023.00 | -1.27% | 162 217.00 | -5 353.00 | -3.30% |
| 31.03.2012 | 158 887.00 | 156 181.00 | 2 706.00 | 1.73% | 161 034.00 | -2 147.00 | -1.33% |
| 31.12.2011 | 156 181.00 | 158 613.00 | -2 432.00 | -1.53% | 160 194.00 | -4 013.00 | -2.50% |
| 30.09.2011 | 158 613.00 | 162 217.00 | -3 604.00 | -2.22% | 152 640.00 | 5 973.00 | 3.91% |
| 30.06.2011 | 162 217.00 | 161 034.00 | 1 183.00 | 0.73% | 145 706.00 | 16 511.00 | 11.33% |
| 31.03.2011 | 161 034.00 | 160 194.00 | 840.00 | 0.52% | 148 952.00 | 12 082.00 | 8.11% |
| 31.12.2010 | 160 194.00 | 152 640.00 | 7 554.00 | 4.95% | 142 408.00 | 17 786.00 | 12.49% |
| 30.09.2010 | 152 640.00 | 145 706.00 | 6 934.00 | 4.76% | 137 072.00 | 15 568.00 | 11.36% |
| 30.06.2010 | 145 706.00 | 148 952.00 | -3 246.00 | -2.18% | 130 552.00 | 15 154.00 | 11.61% |
| 31.03.2010 | 148 952.00 | 142 408.00 | 6 544.00 | 4.60% | 126 207.00 | 22 745.00 | 18.02% |
| 31.12.2009 | 142 408.00 | 137 072.00 | 5 336.00 | 3.89% | 143 925.00 | -1 517.00 | -1.05% |
| 30.09.2009 | 137 072.00 | 130 552.00 | 6 520.00 | 4.99% | 168 336.00 | -31 264.00 | -18.57% |
| 30.06.2009 | 130 552.00 | 126 207.00 | 4 345.00 | 3.44% | 173 287.00 | -42 735.00 | -24.66% |
| 31.03.2009 | 126 207.00 | 143 925.00 | -17 718.00 | -12.31% | 175 041.00 | -48 834.00 | -27.90% |
| 31.12.2008 | 143 925.00 | 168 336.00 | -24 411.00 | -14.50% | 187 011.00 | -43 086.00 | -23.04% |
| 30.09.2008 | 168 336.00 | 173 287.00 | -4 951.00 | -2.86% | 180 719.00 | -12 383.00 | -6.85% |
| 30.06.2008 | 173 287.00 | 175 041.00 | -1 754.00 | -1.00% | 174 460.00 | -1 173.00 | -0.67% |
| 31.03.2008 | 175 041.00 | 187 011.00 | -11 970.00 | -6.40% | 160 287.00 | 14 754.00 | 9.20% |
| 31.12.2007 | 187 011.00 | 180 719.00 | 6 292.00 | 3.48% | 154 413.00 | 32 598.00 | 21.11% |
| 30.09.2007 | 180 719.00 | 174 460.00 | 6 259.00 | 3.59% | 149 374.00 | 31 345.00 | 20.98% |
| 30.06.2007 | 174 460.00 | 160 287.00 | 14 173.00 | 8.84% | 148 114.00 | 26 346.00 | 17.79% |
| 31.03.2007 | 160 287.00 | 154 413.00 | 5 874.00 | 3.80% | 149 395.00 | 10 892.00 | 7.29% |
| 31.12.2006 | 154 413.00 | 149 374.00 | 5 039.00 | 3.37% | 141 697.00 | 12 716.00 | 8.97% |
| 30.09.2006 | 149 374.00 | 148 114.00 | 1 260.00 | 0.85% | 137 175.00 | 12 199.00 | 8.89% |
| 30.06.2006 | 148 114.00 | 149 395.00 | -1 281.00 | -0.86% | 127 091.00 | 21 023.00 | 16.54% |
| 31.03.2006 | 149 395.00 | 141 697.00 | 7 698.00 | 5.43% | 121 482.00 | 27 913.00 | 22.98% |
| 31.12.2005 | 141 697.00 | 137 175.00 | 4 522.00 | 3.30% | 113 901.00 | 27 796.00 | 24.40% |
| 30.09.2005 | 137 175.00 | 127 091.00 | 10 084.00 | 7.93% | 111 285.00 | 25 890.00 | 23.26% |
| 30.06.2005 | 127 091.00 | 121 482.00 | 5 609.00 | 4.62% | 108 829.00 | 18 262.00 | 16.78% |
| 31.03.2005 | 121 482.00 | 113 901.00 | 7 581.00 | 6.66% | 108 468.00 | 13 014.00 | 12.00% |
| 31.12.2004 | 113 901.00 | 111 285.00 | 2 616.00 | 2.35% | - | - | - |
| 30.09.2004 | 111 285.00 | 108 829.00 | 2 456.00 | 2.26% | - | - | - |
| 30.06.2004 | 108 829.00 | 108 468.00 | 361.00 | 0.33% | - | - | - |
| 31.03.2004 | 108 468.00 | - | - | - | - | - | - |
Graf jako obrázek

Podobné sestavy
Aplikace Ekonomika ČNB ze sekce makroekonomika zobrazuje časové řady hlavních makroekonomických údajů z ekonomiky ČR. Najdete zde přes 10.000 grafů různých hodnot od úrokových sazeb, přes statistiky státního rozpočtu, statistiky ČNB a data zpracovávaná ČSÚ. Data jsou k dispozici obvykle za posledních více než 20 let, od prosince roku 1992. Zdroj dat: ČNB ARAD

