Listed shares (AF.511) (Liabilities, stocks, Total economy) - ekonomika ČNB
Aktualizace dat Listed shares (AF.511) (Liabilities, stocks, Total economy) v této aplikaci skončila 30.6.2023. Aktualizovná data časových řad najdete na stránkách nové aplikace z dat ARAD ČNB
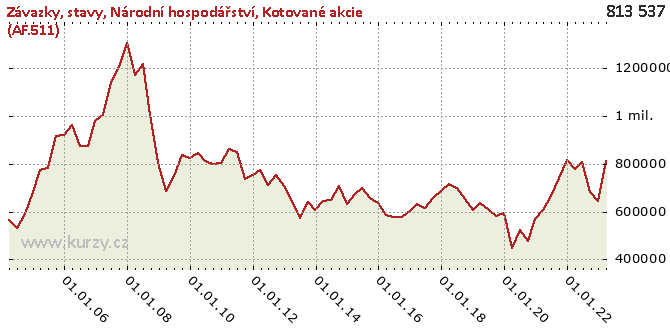
Graf hodnot, Liabilities, stocks, Total economy
Meziroční srovnání
Minima a maxima
| Typ | Období | Hodnota |
|---|---|---|
| Min | 31.03.2020 | 445 280.00 |
| Max | 31.12.2007 | 1 308 630.00 |
Historické hodnoty
| Období | Hodnota | Předchozí | Rozdíl | Změna | Před rokem | Rozdíl | Změna |
|---|---|---|---|---|---|---|---|
| 31.03.2020 | 445 280.00 | 593 853.00 | - 148 573.00 | -25.02% | 635 586.00 | - 190 306.00 | -29.94% |
| 31.12.2019 | 593 853.00 | 579 963.00 | 13 890.00 | 2.39% | 605 421.00 | -11 568.00 | -1.91% |
| 30.09.2019 | 579 963.00 | 611 568.00 | -31 605.00 | -5.17% | 653 359.00 | -73 396.00 | -11.23% |
| 30.06.2019 | 611 568.00 | 635 586.00 | -24 018.00 | -3.78% | 700 785.00 | -89 217.00 | -12.73% |
| 31.03.2019 | 635 586.00 | 605 421.00 | 30 165.00 | 4.98% | 715 377.00 | -79 791.00 | -11.15% |
| 31.12.2018 | 605 421.00 | 653 359.00 | -47 938.00 | -7.34% | 687 414.00 | -81 993.00 | -11.93% |
| 30.09.2018 | 653 359.00 | 700 785.00 | -47 426.00 | -6.77% | 656 956.00 | -3 597.00 | -0.55% |
| 30.06.2018 | 700 785.00 | 715 377.00 | -14 592.00 | -2.04% | 612 956.00 | 87 829.00 | 14.33% |
| 31.03.2018 | 715 377.00 | 687 414.00 | 27 963.00 | 4.07% | 632 544.00 | 82 833.00 | 13.10% |
| 31.12.2017 | 687 414.00 | 656 956.00 | 30 458.00 | 4.64% | 600 310.00 | 87 104.00 | 14.51% |
| 30.09.2017 | 656 956.00 | 612 956.00 | 44 000.00 | 7.18% | 576 567.00 | 80 389.00 | 13.94% |
| 30.06.2017 | 612 956.00 | 632 544.00 | -19 588.00 | -3.10% | 578 071.00 | 34 885.00 | 6.03% |
| 31.03.2017 | 632 544.00 | 600 310.00 | 32 234.00 | 5.37% | 583 563.00 | 48 981.00 | 8.39% |
| 31.12.2016 | 600 310.00 | 576 567.00 | 23 743.00 | 4.12% | 636 767.00 | -36 457.00 | -5.73% |
| 30.09.2016 | 576 567.00 | 578 071.00 | -1 504.00 | -0.26% | 654 977.00 | -78 410.00 | -11.97% |
| 30.06.2016 | 578 071.00 | 583 563.00 | -5 492.00 | -0.94% | 699 032.00 | - 120 961.00 | -17.30% |
| 31.03.2016 | 583 563.00 | 636 767.00 | -53 204.00 | -8.36% | 671 584.00 | -88 021.00 | -13.11% |
| 31.12.2015 | 636 767.00 | 654 977.00 | -18 210.00 | -2.78% | 629 885.00 | 6 882.00 | 1.09% |
| 30.09.2015 | 654 977.00 | 699 032.00 | -44 055.00 | -6.30% | 708 805.00 | -53 828.00 | -7.59% |
| 30.06.2015 | 699 032.00 | 671 584.00 | 27 448.00 | 4.09% | 648 166.00 | 50 866.00 | 7.85% |
| 31.03.2015 | 671 584.00 | 629 885.00 | 41 699.00 | 6.62% | 642 225.00 | 29 359.00 | 4.57% |
| 31.12.2014 | 629 885.00 | 708 805.00 | -78 920.00 | -11.13% | 605 132.00 | 24 753.00 | 4.09% |
| 30.09.2014 | 708 805.00 | 648 166.00 | 60 639.00 | 9.36% | 637 947.00 | 70 858.00 | 11.11% |
| 30.06.2014 | 648 166.00 | 642 225.00 | 5 941.00 | 0.93% | 570 869.00 | 77 297.00 | 13.54% |
| 31.03.2014 | 642 225.00 | 605 132.00 | 37 093.00 | 6.13% | 645 316.00 | -3 091.00 | -0.48% |
| 31.12.2013 | 605 132.00 | 637 947.00 | -32 815.00 | -5.14% | 708 490.00 | - 103 358.00 | -14.59% |
| 30.09.2013 | 637 947.00 | 570 869.00 | 67 078.00 | 11.75% | 753 960.00 | - 116 013.00 | -15.39% |
| 30.06.2013 | 570 869.00 | 645 316.00 | -74 447.00 | -11.54% | 712 985.00 | - 142 116.00 | -19.93% |
| 31.03.2013 | 645 316.00 | 708 490.00 | -63 174.00 | -8.92% | 774 225.00 | - 128 909.00 | -16.65% |
| 31.12.2012 | 708 490.00 | 753 960.00 | -45 470.00 | -6.03% | 753 174.00 | -44 684.00 | -5.93% |
| 30.09.2012 | 753 960.00 | 712 985.00 | 40 975.00 | 5.75% | 734 427.00 | 19 533.00 | 2.66% |
| 30.06.2012 | 712 985.00 | 774 225.00 | -61 240.00 | -7.91% | 851 115.00 | - 138 130.00 | -16.23% |
| 31.03.2012 | 774 225.00 | 753 174.00 | 21 051.00 | 2.79% | 863 469.00 | -89 244.00 | -10.34% |
| 31.12.2011 | 753 174.00 | 734 427.00 | 18 747.00 | 2.55% | 804 972.00 | -51 798.00 | -6.43% |
| 30.09.2011 | 734 427.00 | 851 115.00 | - 116 688.00 | -13.71% | 798 997.00 | -64 570.00 | -8.08% |
| 30.06.2011 | 851 115.00 | 863 469.00 | -12 354.00 | -1.43% | 810 905.00 | 40 210.00 | 4.96% |
| 31.03.2011 | 863 469.00 | 804 972.00 | 58 497.00 | 7.27% | 847 279.00 | 16 190.00 | 1.91% |
| 31.12.2010 | 804 972.00 | 798 997.00 | 5 975.00 | 0.75% | 825 085.00 | -20 113.00 | -2.44% |
| 30.09.2010 | 798 997.00 | 810 905.00 | -11 908.00 | -1.47% | 839 088.00 | -40 091.00 | -4.78% |
| 30.06.2010 | 810 905.00 | 847 279.00 | -36 374.00 | -4.29% | 748 271.00 | 62 634.00 | 8.37% |
| 31.03.2010 | 847 279.00 | 825 085.00 | 22 194.00 | 2.69% | 685 634.00 | 161 645.00 | 23.58% |
| 31.12.2009 | 825 085.00 | 839 088.00 | -14 003.00 | -1.67% | 805 440.00 | 19 645.00 | 2.44% |
| 30.09.2009 | 839 088.00 | 748 271.00 | 90 817.00 | 12.14% | 1 004 911.00 | - 165 823.00 | -16.50% |
| 30.06.2009 | 748 271.00 | 685 634.00 | 62 637.00 | 9.14% | 1 216 725.00 | - 468 454.00 | -38.50% |
| 31.03.2009 | 685 634.00 | 805 440.00 | - 119 806.00 | -14.87% | 1 171 926.00 | - 486 292.00 | -41.50% |
| 31.12.2008 | 805 440.00 | 1 004 911.00 | - 199 471.00 | -19.85% | 1 308 630.00 | - 503 190.00 | -38.45% |
| 30.09.2008 | 1 004 911.00 | 1 216 725.00 | - 211 814.00 | -17.41% | 1 207 830.00 | - 202 919.00 | -16.80% |
| 30.06.2008 | 1 216 725.00 | 1 171 926.00 | 44 799.00 | 3.82% | 1 140 467.00 | 76 258.00 | 6.69% |
| 31.03.2008 | 1 171 926.00 | 1 308 630.00 | - 136 704.00 | -10.45% | 1 005 814.00 | 166 112.00 | 16.52% |
| 31.12.2007 | 1 308 630.00 | 1 207 830.00 | 100 800.00 | 8.35% | 977 652.00 | 330 978.00 | 33.85% |
| 30.09.2007 | 1 207 830.00 | 1 140 467.00 | 67 363.00 | 5.91% | 873 550.00 | 334 280.00 | 38.27% |
| 30.06.2007 | 1 140 467.00 | 1 005 814.00 | 134 653.00 | 13.39% | 874 166.00 | 266 301.00 | 30.46% |
| 31.03.2007 | 1 005 814.00 | 977 652.00 | 28 162.00 | 2.88% | 963 152.00 | 42 662.00 | 4.43% |
| 31.12.2006 | 977 652.00 | 873 550.00 | 104 102.00 | 11.92% | 920 993.00 | 56 659.00 | 6.15% |
| 30.09.2006 | 873 550.00 | 874 166.00 | - 616.00 | -0.07% | 915 059.00 | -41 509.00 | -4.54% |
| 30.06.2006 | 874 166.00 | 963 152.00 | -88 986.00 | -9.24% | 782 301.00 | 91 865.00 | 11.74% |
| 31.03.2006 | 963 152.00 | 920 993.00 | 42 159.00 | 4.58% | 774 750.00 | 188 402.00 | 24.32% |
| 31.12.2005 | 920 993.00 | 915 059.00 | 5 934.00 | 0.65% | 682 261.00 | 238 732.00 | 34.99% |
| 30.09.2005 | 915 059.00 | 782 301.00 | 132 758.00 | 16.97% | 587 641.00 | 327 418.00 | 55.72% |
| 30.06.2005 | 782 301.00 | 774 750.00 | 7 551.00 | 0.97% | 530 728.00 | 251 573.00 | 47.40% |
| 31.03.2005 | 774 750.00 | 682 261.00 | 92 489.00 | 13.56% | 566 535.00 | 208 215.00 | 36.75% |
| 31.12.2004 | 682 261.00 | 587 641.00 | 94 620.00 | 16.10% | - | - | - |
| 30.09.2004 | 587 641.00 | 530 728.00 | 56 913.00 | 10.72% | - | - | - |
| 30.06.2004 | 530 728.00 | 566 535.00 | -35 807.00 | -6.32% | - | - | - |
| 31.03.2004 | 566 535.00 | - | - | - | - | - | - |
Graf jako obrázek

Podobné sestavy
Aplikace Ekonomika ČNB ze sekce makroekonomika zobrazuje časové řady hlavních makroekonomických údajů z ekonomiky ČR. Najdete zde přes 10.000 grafů různých hodnot od úrokových sazeb, přes statistiky státního rozpočtu, statistiky ČNB a data zpracovávaná ČSÚ. Data jsou k dispozici obvykle za posledních více než 20 let, od prosince roku 1992. Zdroj dat: ČNB ARAD

