Mutual funds shares/units issued (Mixed funds balance sheet) - ekonomika ČNB
Aktualizace dat Mutual funds shares/units issued (Mixed funds balance sheet) v této aplikaci skončila 30.6.2023. Aktualizovná data časových řad najdete na stránkách nové aplikace z dat ARAD ČNB
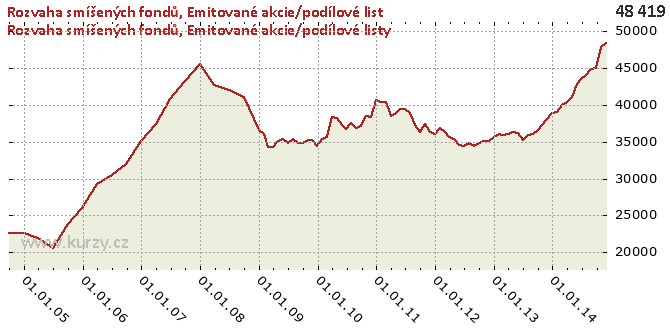
Graf hodnot, Mixed funds balance sheet
Meziroční srovnání
Minima a maxima
| Typ | Období | Hodnota |
|---|---|---|
| Max | 30.11.2014 | 48 419.30 |
| Min | 30.06.2005 | 20 525.28 |
Historické hodnoty
| Období | Hodnota | Předchozí | Rozdíl | Změna | Před rokem | Rozdíl | Změna |
|---|---|---|---|---|---|---|---|
| 30.11.2014 | 48 419.30 | 47 806.17 | 613.12 | 1.28% | 38 019.32 | 10 399.98 | 27.35% |
| 31.10.2014 | 47 806.17 | 45 028.41 | 2 777.77 | 6.17% | 37 315.76 | 10 490.41 | 28.11% |
| 30.09.2014 | 45 028.41 | 44 898.94 | 129.47 | 0.29% | 36 554.88 | 8 473.53 | 23.18% |
| 31.08.2014 | 44 898.94 | 44 039.46 | 859.48 | 1.95% | 35 974.11 | 8 924.83 | 24.81% |
| 31.07.2014 | 44 039.46 | 43 511.61 | 527.84 | 1.21% | 35 858.80 | 8 180.66 | 22.81% |
| 30.06.2014 | 43 511.61 | 42 839.61 | 672.00 | 1.57% | 35 160.01 | 8 351.60 | 23.75% |
| 31.05.2014 | 42 839.61 | 41 029.71 | 1 809.90 | 4.41% | 36 187.28 | 6 652.34 | 18.38% |
| 30.04.2014 | 41 029.71 | 40 301.25 | 728.46 | 1.81% | 36 359.18 | 4 670.54 | 12.85% |
| 31.03.2014 | 40 301.25 | 39 895.56 | 405.69 | 1.02% | 36 076.82 | 4 224.44 | 11.71% |
| 28.02.2014 | 39 895.56 | 39 048.52 | 847.04 | 2.17% | 35 850.28 | 4 045.28 | 11.28% |
| 31.01.2014 | 39 048.52 | 38 846.43 | 202.08 | 0.52% | 35 982.73 | 3 065.78 | 8.52% |
| 31.12.2013 | 38 846.43 | 38 019.32 | 827.11 | 2.18% | 35 568.34 | 3 278.10 | 9.22% |
| 30.11.2013 | 38 019.32 | 37 315.76 | 703.56 | 1.89% | 35 066.17 | 2 953.14 | 8.42% |
| 31.10.2013 | 37 315.76 | 36 554.88 | 760.88 | 2.08% | 35 113.34 | 2 202.42 | 6.27% |
| 30.09.2013 | 36 554.88 | 35 974.11 | 580.77 | 1.61% | 34 847.28 | 1 707.60 | 4.90% |
| 31.08.2013 | 35 974.11 | 35 858.80 | 115.31 | 0.32% | 34 363.74 | 1 610.37 | 4.69% |
| 31.07.2013 | 35 858.80 | 35 160.01 | 698.78 | 1.99% | 34 801.71 | 1 057.09 | 3.04% |
| 30.06.2013 | 35 160.01 | 36 187.28 | -1 027.26 | -2.84% | 34 430.80 | 729.21 | 2.12% |
| 31.05.2013 | 36 187.28 | 36 359.18 | - 171.90 | -0.47% | 34 492.17 | 1 695.11 | 4.91% |
| 30.04.2013 | 36 359.18 | 36 076.82 | 282.36 | 0.78% | 35 383.03 | 976.14 | 2.76% |
| 31.03.2013 | 36 076.82 | 35 850.28 | 226.54 | 0.63% | 35 680.06 | 396.75 | 1.11% |
| 28.02.2013 | 35 850.28 | 35 982.73 | - 132.46 | -0.37% | 36 492.13 | - 641.86 | -1.76% |
| 31.01.2013 | 35 982.73 | 35 568.34 | 414.39 | 1.17% | 36 858.13 | - 875.40 | -2.38% |
| 31.12.2012 | 35 568.34 | 35 066.17 | 502.16 | 1.43% | 36 080.02 | - 511.68 | -1.42% |
| 30.11.2012 | 35 066.17 | 35 113.34 | -47.17 | -0.13% | 36 254.89 | -1 188.72 | -3.28% |
| 31.10.2012 | 35 113.34 | 34 847.28 | 266.06 | 0.76% | 37 375.70 | -2 262.36 | -6.05% |
| 30.09.2012 | 34 847.28 | 34 363.74 | 483.55 | 1.41% | 36 323.19 | -1 475.91 | -4.06% |
| 31.08.2012 | 34 363.74 | 34 801.71 | - 437.97 | -1.26% | 37 250.73 | -2 886.99 | -7.75% |
| 31.07.2012 | 34 801.71 | 34 430.80 | 370.90 | 1.08% | 38 842.04 | -4 040.33 | -10.40% |
| 30.06.2012 | 34 430.80 | 34 492.17 | -61.37 | -0.18% | 39 390.18 | -4 959.38 | -12.59% |
| 31.05.2012 | 34 492.17 | 35 383.03 | - 890.86 | -2.52% | 39 409.87 | -4 917.70 | -12.48% |
| 30.04.2012 | 35 383.03 | 35 680.06 | - 297.03 | -0.83% | 38 802.10 | -3 419.07 | -8.81% |
| 31.03.2012 | 35 680.06 | 36 492.13 | - 812.07 | -2.23% | 38 438.66 | -2 758.60 | -7.18% |
| 29.02.2012 | 36 492.13 | 36 858.13 | - 366.00 | -0.99% | 40 428.55 | -3 936.42 | -9.74% |
| 31.01.2012 | 36 858.13 | 36 080.02 | 778.11 | 2.16% | 40 334.71 | -3 476.58 | -8.62% |
| 31.12.2011 | 36 080.02 | 36 254.89 | - 174.87 | -0.48% | 40 584.01 | -4 503.99 | -11.10% |
| 30.11.2011 | 36 254.89 | 37 375.70 | -1 120.81 | -3.00% | 38 313.12 | -2 058.23 | -5.37% |
| 31.10.2011 | 37 375.70 | 36 323.19 | 1 052.51 | 2.90% | 38 474.41 | -1 098.70 | -2.86% |
| 30.09.2011 | 36 323.19 | 37 250.73 | - 927.53 | -2.49% | 37 123.17 | - 799.97 | -2.15% |
| 31.08.2011 | 37 250.73 | 38 842.04 | -1 591.31 | -4.10% | 36 888.32 | 362.41 | 0.98% |
| 31.07.2011 | 38 842.04 | 39 390.18 | - 548.14 | -1.39% | 37 454.49 | 1 387.55 | 3.70% |
| 30.06.2011 | 39 390.18 | 39 409.87 | -19.69 | -0.05% | 36 756.73 | 2 633.45 | 7.16% |
| 31.05.2011 | 39 409.87 | 38 802.10 | 607.76 | 1.57% | 37 273.19 | 2 136.68 | 5.73% |
| 30.04.2011 | 38 802.10 | 38 438.66 | 363.44 | 0.95% | 38 248.99 | 553.11 | 1.45% |
| 31.03.2011 | 38 438.66 | 40 428.55 | -1 989.89 | -4.92% | 38 376.74 | 61.92 | 0.16% |
| 28.02.2011 | 40 428.55 | 40 334.71 | 93.84 | 0.23% | 35 576.06 | 4 852.49 | 13.64% |
| 31.01.2011 | 40 334.71 | 40 584.01 | - 249.30 | -0.61% | 35 341.28 | 4 993.43 | 14.13% |
| 31.12.2010 | 40 584.01 | 38 313.12 | 2 270.88 | 5.93% | 34 342.86 | 6 241.14 | 18.17% |
| 30.11.2010 | 38 313.12 | 38 474.41 | - 161.28 | -0.42% | 35 285.20 | 3 027.93 | 8.58% |
| 31.10.2010 | 38 474.41 | 37 123.17 | 1 351.24 | 3.64% | 35 212.82 | 3 261.59 | 9.26% |
| 30.09.2010 | 37 123.17 | 36 888.32 | 234.85 | 0.64% | 34 875.56 | 2 247.61 | 6.44% |
| 31.08.2010 | 36 888.32 | 37 454.49 | - 566.17 | -1.51% | 34 773.84 | 2 114.48 | 6.08% |
| 31.07.2010 | 37 454.49 | 36 756.73 | 697.76 | 1.90% | 35 364.00 | 2 090.49 | 5.91% |
| 30.06.2010 | 36 756.73 | 37 273.19 | - 516.46 | -1.39% | 34 878.43 | 1 878.30 | 5.39% |
| 31.05.2010 | 37 273.19 | 38 248.99 | - 975.80 | -2.55% | 35 345.21 | 1 927.97 | 5.45% |
| 30.04.2010 | 38 248.99 | 38 376.74 | - 127.74 | -0.33% | 35 040.59 | 3 208.41 | 9.16% |
| 31.03.2010 | 38 376.74 | 35 576.06 | 2 800.68 | 7.87% | 34 244.49 | 4 132.25 | 12.07% |
| 28.02.2010 | 35 576.06 | 35 341.28 | 234.78 | 0.66% | 34 321.73 | 1 254.32 | 3.65% |
| 31.01.2010 | 35 341.28 | 34 342.86 | 998.41 | 2.91% | 36 050.92 | - 709.64 | -1.97% |
| 31.12.2009 | 34 342.86 | 35 285.20 | - 942.33 | -2.67% | 36 600.65 | -2 257.79 | -6.17% |
| 30.11.2009 | 35 285.20 | 35 212.82 | 72.38 | 0.21% | 41 027.68 | -5 742.48 | -14.00% |
| 31.10.2009 | 35 212.82 | 34 875.56 | 337.26 | 0.97% | 41 027.68 | -5 814.87 | -14.17% |
| 30.09.2009 | 34 875.56 | 34 773.84 | 101.72 | 0.29% | 41 027.68 | -6 152.12 | -14.99% |
| 31.08.2009 | 34 773.84 | 35 364.00 | - 590.16 | -1.67% | 42 001.27 | -7 227.43 | -17.21% |
| 31.07.2009 | 35 364.00 | 34 878.43 | 485.56 | 1.39% | 42 001.27 | -6 637.27 | -15.80% |
| 30.06.2009 | 34 878.43 | 35 345.21 | - 466.78 | -1.32% | 42 001.27 | -7 122.84 | -16.96% |
| 31.05.2009 | 35 345.21 | 35 040.59 | 304.63 | 0.87% | 42 709.85 | -7 364.64 | -17.24% |
| 30.04.2009 | 35 040.59 | 34 244.49 | 796.10 | 2.32% | 42 709.85 | -7 669.26 | -17.96% |
| 31.03.2009 | 34 244.49 | 34 321.73 | -77.24 | -0.23% | 42 709.85 | -8 465.36 | -19.82% |
| 28.02.2009 | 34 321.73 | 36 050.92 | -1 729.19 | -4.80% | 45 546.86 | -11 225.13 | -24.65% |
| 31.01.2009 | 36 050.92 | 36 600.65 | - 549.73 | -1.50% | 45 546.86 | -9 495.94 | -20.85% |
| 31.12.2008 | 36 600.65 | 41 027.68 | -4 427.03 | -10.79% | 45 546.86 | -8 946.21 | -19.64% |
| 30.09.2008 | 41 027.68 | 42 001.27 | - 973.59 | -2.32% | 43 170.11 | -2 142.43 | -4.96% |
| 30.06.2008 | 42 001.27 | 42 709.85 | - 708.58 | -1.66% | 40 711.31 | 1 289.96 | 3.17% |
| 31.03.2008 | 42 709.85 | 45 546.86 | -2 837.01 | -6.23% | 37 398.61 | 5 311.24 | 14.20% |
| 31.12.2007 | 45 546.86 | 43 170.11 | 2 376.74 | 5.51% | 35 050.51 | 10 496.35 | 29.95% |
| 30.09.2007 | 43 170.11 | 40 711.31 | 2 458.80 | 6.04% | 31 932.42 | 11 237.69 | 35.19% |
| 30.06.2007 | 40 711.31 | 37 398.61 | 3 312.70 | 8.86% | 30 435.34 | 10 275.97 | 33.76% |
| 31.03.2007 | 37 398.61 | 35 050.51 | 2 348.11 | 6.70% | 29 212.79 | 8 185.82 | 28.02% |
| 31.12.2006 | 35 050.51 | 31 932.42 | 3 118.09 | 9.76% | 25 949.06 | 9 101.44 | 35.07% |
| 30.09.2006 | 31 932.42 | 30 435.34 | 1 497.08 | 4.92% | 23 830.94 | 8 101.48 | 34.00% |
| 30.06.2006 | 30 435.34 | 29 212.79 | 1 222.54 | 4.18% | 20 525.28 | 9 910.05 | 48.28% |
| 31.03.2006 | 29 212.79 | 25 949.06 | 3 263.73 | 12.58% | 21 909.12 | 7 303.67 | 33.34% |
| 31.12.2005 | 25 949.06 | 23 830.94 | 2 118.12 | 8.89% | 22 574.74 | 3 374.32 | 14.95% |
| 30.09.2005 | 23 830.94 | 20 525.28 | 3 305.66 | 16.11% | 22 565.59 | 1 265.35 | 5.61% |
| 30.06.2005 | 20 525.28 | 21 909.12 | -1 383.84 | -6.32% | - | - | - |
| 31.03.2005 | 21 909.12 | 22 574.74 | - 665.62 | -2.95% | - | - | - |
| 31.12.2004 | 22 574.74 | 22 565.59 | 9.16 | 0.04% | - | - | - |
| 30.09.2004 | 22 565.59 | - | - | - | - | - | - |
Graf jako obrázek

Podobné sestavy
Aplikace Ekonomika ČNB ze sekce makroekonomika zobrazuje časové řady hlavních makroekonomických údajů z ekonomiky ČR. Najdete zde přes 10.000 grafů různých hodnot od úrokových sazeb, přes statistiky státního rozpočtu, statistiky ČNB a data zpracovávaná ČSÚ. Data jsou k dispozici obvykle za posledních více než 20 let, od prosince roku 1992. Zdroj dat: ČNB ARAD

