Investment fund shares/units (Mixed Funds Balance Sheet - Flows) - ekonomika ČNB
Aktualizace dat Investment fund shares/units (Mixed Funds Balance Sheet - Flows) v této aplikaci skončila 30.6.2023. Aktualizovná data časových řad najdete na stránkách nové aplikace z dat ARAD ČNB
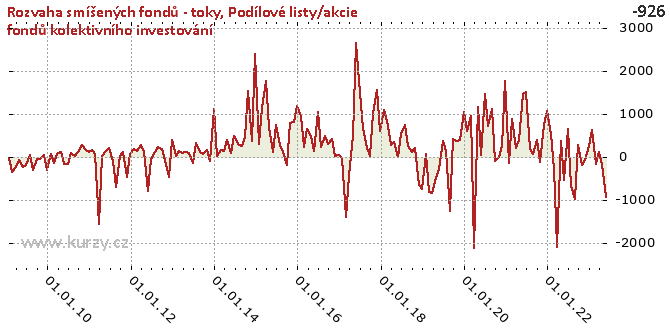
Graf hodnot, Mixed Funds Balance Sheet - Flows
Meziroční srovnání
Minima a maxima
| Typ | Období | Hodnota |
|---|---|---|
| Min | 31.03.2020 | -2 093.12 |
| Max | 31.05.2017 | 2 662.86 |
Historické hodnoty
| Období | Hodnota | Předchozí | Rozdíl | Změna | Před rokem | Rozdíl | Změna |
|---|---|---|---|---|---|---|---|
| 30.06.2020 | 1 480.42 | 145.61 | 1 334.81 | 916.70% | 368.93 | 1 111.49 | 301.27% |
| 31.05.2020 | 145.61 | 1 180.99 | -1 035.38 | -87.67% | - 293.99 | 439.61 | - 149.53% |
| 30.04.2020 | 1 180.99 | -2 093.12 | 3 274.11 | - 156.42% | - 488.09 | 1 669.08 | - 341.96% |
| 31.03.2020 | -2 093.12 | 929.94 | -3 023.06 | - 325.08% | - 837.34 | -1 255.78 | 149.97% |
| 29.02.2020 | 929.94 | 621.22 | 308.73 | 49.70% | - 817.22 | 1 747.17 | - 213.79% |
| 31.01.2020 | 621.22 | 1 260.22 | - 639.01 | -50.71% | 60.56 | 560.65 | 925.72% |
| 31.12.2019 | 1 260.22 | 383.20 | 877.03 | 228.87% | - 739.50 | 1 999.73 | - 270.41% |
| 30.11.2019 | 383.20 | 365.75 | 17.44 | 4.77% | - 662.48 | 1 045.67 | - 157.84% |
| 31.10.2019 | 365.75 | 410.81 | -45.06 | -10.97% | 198.86 | 166.89 | 83.93% |
| 30.09.2019 | 410.81 | -1 261.90 | 1 672.71 | - 132.55% | 109.12 | 301.69 | 276.47% |
| 31.08.2019 | -1 261.90 | 137.54 | -1 399.44 | -1 017.51% | 254.81 | -1 516.72 | - 595.22% |
| 31.07.2019 | 137.54 | 368.93 | - 231.40 | -62.72% | 735.12 | - 597.59 | -81.29% |
| 30.06.2019 | 368.93 | - 293.99 | 662.93 | - 225.49% | 522.69 | - 153.75 | -29.42% |
| 31.05.2019 | - 293.99 | - 488.09 | 194.10 | -39.77% | -6.10 | - 287.89 | 4 718.78% |
| 30.04.2019 | - 488.09 | - 837.34 | 349.25 | -41.71% | 339.93 | - 828.02 | - 243.58% |
| 31.03.2019 | - 837.34 | - 817.22 | -20.11 | 2.46% | 281.99 | -1 119.33 | - 396.94% |
| 28.02.2019 | - 817.22 | 60.56 | - 877.79 | -1 449.36% | 845.67 | -1 662.89 | - 196.64% |
| 31.01.2019 | 60.56 | - 739.50 | 800.07 | - 108.19% | 1 086.40 | -1 025.84 | -94.43% |
| 31.12.2018 | - 739.50 | - 662.48 | -77.03 | 11.63% | 591.11 | -1 330.61 | - 225.10% |
| 30.11.2018 | - 662.48 | 198.86 | - 861.34 | - 433.14% | 1 546.33 | -2 208.81 | - 142.84% |
| 31.10.2018 | 198.86 | 109.12 | 89.74 | 82.24% | 1 020.99 | - 822.13 | -80.52% |
| 30.09.2018 | 109.12 | 254.81 | - 145.69 | -57.18% | 11.18 | 97.95 | 876.47% |
| 31.08.2018 | 254.81 | 735.12 | - 480.31 | -65.34% | 217.24 | 37.57 | 17.29% |
| 31.07.2018 | 735.12 | 522.69 | 212.44 | 40.64% | 663.39 | 71.74 | 10.81% |
| 30.06.2018 | 522.69 | -6.10 | 528.79 | -8 667.25% | 1 758.62 | -1 235.93 | -70.28% |
| 31.05.2018 | -6.10 | 339.93 | - 346.04 | - 101.79% | 2 662.86 | -2 668.96 | - 100.23% |
| 30.04.2018 | 339.93 | 281.99 | 57.94 | 20.55% | 478.26 | - 138.32 | -28.92% |
| 31.03.2018 | 281.99 | 845.67 | - 563.68 | -66.65% | - 449.65 | 731.64 | - 162.71% |
| 28.02.2018 | 845.67 | 1 086.40 | - 240.73 | -22.16% | -1 411.59 | 2 257.26 | - 159.91% |
| 31.01.2018 | 1 086.40 | 591.11 | 495.29 | 83.79% | -25.93 | 1 112.32 | -4 290.55% |
| 31.12.2017 | 591.11 | 1 546.33 | - 955.23 | -61.77% | 51.47 | 539.64 | 1 048.41% |
| 30.11.2017 | 1 546.33 | 1 020.99 | 525.34 | 51.45% | 25.21 | 1 521.12 | 6 033.08% |
| 31.10.2017 | 1 020.99 | 11.18 | 1 009.82 | 9 036.39% | 421.31 | 599.68 | 142.34% |
| 30.09.2017 | 11.18 | 217.24 | - 206.07 | -94.86% | 296.04 | - 284.86 | -96.23% |
| 31.08.2017 | 217.24 | 663.39 | - 446.14 | -67.25% | 494.68 | - 277.44 | -56.08% |
| 31.07.2017 | 663.39 | 1 758.62 | -1 095.23 | -62.28% | 225.44 | 437.95 | 194.27% |
| 30.06.2017 | 1 758.62 | 2 662.86 | - 904.24 | -33.96% | 1 051.02 | 707.60 | 67.33% |
| 31.05.2017 | 2 662.86 | 478.26 | 2 184.60 | 456.78% | 132.87 | 2 529.99 | 1 904.12% |
| 30.04.2017 | 478.26 | - 449.65 | 927.91 | - 206.36% | 484.43 | -6.17 | -1.27% |
| 31.03.2017 | - 449.65 | -1 411.59 | 961.94 | -68.15% | 659.00 | -1 108.65 | - 168.23% |
| 28.02.2017 | -1 411.59 | -25.93 | -1 385.67 | 5 344.91% | 236.71 | -1 648.31 | - 696.33% |
| 31.01.2017 | -25.93 | 51.47 | -77.40 | - 150.37% | 947.17 | - 973.09 | - 102.74% |
| 31.12.2016 | 51.47 | 25.21 | 26.26 | 104.15% | 1 185.86 | -1 134.39 | -95.66% |
| 30.11.2016 | 25.21 | 421.31 | - 396.10 | -94.02% | 808.68 | - 783.47 | -96.88% |
| 31.10.2016 | 421.31 | 296.04 | 125.28 | 42.32% | 792.80 | - 371.49 | -46.86% |
| 30.09.2016 | 296.04 | 494.68 | - 198.64 | -40.16% | - 181.82 | 477.86 | - 262.82% |
| 31.08.2016 | 494.68 | 225.44 | 269.24 | 119.43% | 106.21 | 388.47 | 365.74% |
| 31.07.2016 | 225.44 | 1 051.02 | - 825.58 | -78.55% | 270.33 | -44.90 | -16.61% |
| 30.06.2016 | 1 051.02 | 132.87 | 918.15 | 691.02% | 742.37 | 308.65 | 41.58% |
| 31.05.2016 | 132.87 | 484.43 | - 351.56 | -72.57% | 102.57 | 30.30 | 29.53% |
| 30.04.2016 | 484.43 | 659.00 | - 174.58 | -26.49% | 693.26 | - 208.83 | -30.12% |
| 31.03.2016 | 659.00 | 236.71 | 422.29 | 178.40% | 1 763.54 | -1 104.54 | -62.63% |
| 29.02.2016 | 236.71 | 947.17 | - 710.46 | -75.01% | 1 130.38 | - 893.67 | -79.06% |
| 31.01.2016 | 947.17 | 1 185.86 | - 238.69 | -20.13% | 302.14 | 645.02 | 213.48% |
| 31.12.2015 | 1 185.86 | 808.68 | 377.18 | 46.64% | 2 405.38 | -1 219.52 | -50.70% |
| 30.11.2015 | 808.68 | 792.80 | 15.88 | 2.00% | 373.78 | 434.90 | 116.35% |
| 31.10.2015 | 792.80 | - 181.82 | 974.63 | - 536.03% | 1 531.63 | - 738.82 | -48.24% |
| 30.09.2015 | - 181.82 | 106.21 | - 288.04 | - 271.19% | 455.88 | - 637.70 | - 139.88% |
| 31.08.2015 | 106.21 | 270.33 | - 164.12 | -60.71% | 249.95 | - 143.73 | -57.51% |
| 31.07.2015 | 270.33 | 742.37 | - 472.04 | -63.59% | 296.42 | -26.09 | -8.80% |
| 30.06.2015 | 742.37 | 102.57 | 639.80 | 623.74% | 476.94 | 265.43 | 55.65% |
| 31.05.2015 | 102.57 | 693.26 | - 590.68 | -85.20% | 99.24 | 3.34 | 3.36% |
| 30.04.2015 | 693.26 | 1 763.54 | -1 070.28 | -60.69% | 396.46 | 296.80 | 74.86% |
| 31.03.2015 | 1 763.54 | 1 130.38 | 633.16 | 56.01% | 127.75 | 1 635.79 | 1 280.48% |
| 28.02.2015 | 1 130.38 | 302.14 | 828.24 | 274.12% | 161.92 | 968.46 | 598.10% |
| 31.01.2015 | 302.14 | 2 405.38 | -2 103.24 | -87.44% | 26.41 | 275.73 | 1 044.04% |
| 31.12.2014 | 2 405.38 | 373.78 | 2 031.60 | 543.53% | 1 116.00 | 1 289.38 | 115.54% |
| 30.11.2014 | 373.78 | 1 531.63 | -1 157.85 | -75.60% | -87.25 | 461.04 | - 528.38% |
| 31.10.2014 | 1 531.63 | 455.88 | 1 075.75 | 235.97% | 162.68 | 1 368.94 | 841.47% |
| 30.09.2014 | 455.88 | 249.95 | 205.93 | 82.39% | 73.94 | 381.93 | 516.52% |
| 31.08.2014 | 249.95 | 296.42 | -46.47 | -15.68% | 110.60 | 139.35 | 125.99% |
| 31.07.2014 | 296.42 | 476.94 | - 180.52 | -37.85% | 325.38 | -28.96 | -8.90% |
| 30.06.2014 | 476.94 | 99.24 | 377.70 | 380.60% | - 138.87 | 615.81 | - 443.44% |
| 31.05.2014 | 99.24 | 396.46 | - 297.22 | -74.97% | 97.17 | 2.06 | 2.12% |
| 30.04.2014 | 396.46 | 127.75 | 268.71 | 210.34% | 115.23 | 281.22 | 244.05% |
| 31.03.2014 | 127.75 | 161.92 | -34.17 | -21.11% | 88.83 | 38.92 | 43.81% |
| 28.02.2014 | 161.92 | 26.41 | 135.51 | 513.11% | 138.53 | 23.39 | 16.89% |
| 31.01.2014 | 26.41 | 1 116.00 | -1 089.59 | -97.63% | 7.84 | 18.57 | 236.78% |
| 31.12.2013 | 1 116.00 | -87.25 | 1 203.25 | -1 379.01% | 383.84 | 732.16 | 190.75% |
| 30.11.2013 | -87.25 | 162.68 | - 249.94 | - 153.63% | - 481.13 | 393.87 | -81.86% |
| 31.10.2013 | 162.68 | 73.94 | 88.74 | 120.01% | -97.41 | 260.09 | - 267.01% |
| 30.09.2013 | 73.94 | 110.60 | -36.66 | -33.14% | 173.50 | -99.56 | -57.38% |
| 31.08.2013 | 110.60 | 325.38 | - 214.78 | -66.01% | 228.69 | - 118.09 | -51.64% |
| 31.07.2013 | 325.38 | - 138.87 | 464.25 | - 334.30% | 120.43 | 204.95 | 170.18% |
| 30.06.2013 | - 138.87 | 97.17 | - 236.04 | - 242.91% | -40.61 | -98.26 | 241.96% |
| 31.05.2013 | 97.17 | 115.23 | -18.06 | -15.67% | - 802.75 | 899.92 | - 112.11% |
| 30.04.2013 | 115.23 | 88.83 | 26.40 | 29.72% | 116.91 | -1.68 | -1.43% |
| 31.03.2013 | 88.83 | 138.53 | -49.70 | -35.88% | 277.72 | - 188.89 | -68.01% |
| 28.02.2013 | 138.53 | 7.84 | 130.69 | 1 666.53% | 142.35 | -3.82 | -2.68% |
| 31.01.2013 | 7.84 | 383.84 | - 376.00 | -97.96% | 185.38 | - 177.54 | -95.77% |
| 31.12.2012 | 383.84 | - 481.13 | 864.96 | - 179.78% | 76.19 | 307.65 | 403.82% |
| 30.11.2012 | - 481.13 | -97.41 | - 383.72 | 393.93% | - 472.83 | -8.29 | 1.75% |
| 31.10.2012 | -97.41 | 173.50 | - 270.90 | - 156.14% | 120.63 | - 218.04 | - 180.75% |
| 30.09.2012 | 173.50 | 228.69 | -55.19 | -24.13% | 8.99 | 164.51 | 1 829.47% |
| 31.08.2012 | 228.69 | 120.43 | 108.26 | 89.90% | - 709.43 | 938.12 | - 132.24% |
| 31.07.2012 | 120.43 | -40.61 | 161.04 | - 396.54% | -92.19 | 212.62 | - 230.63% |
| 30.06.2012 | -40.61 | - 802.75 | 762.13 | -94.94% | 198.75 | - 239.36 | - 120.43% |
| 31.05.2012 | - 802.75 | 116.91 | - 919.66 | - 786.64% | 125.08 | - 927.83 | - 741.76% |
| 30.04.2012 | 116.91 | 277.72 | - 160.81 | -57.90% | 16.64 | 100.27 | 602.67% |
| 31.03.2012 | 277.72 | 142.35 | 135.36 | 95.09% | -1 565.89 | 1 843.61 | - 117.74% |
| 29.02.2012 | 142.35 | 185.38 | -43.03 | -23.21% | 60.11 | 82.24 | 136.82% |
| 31.01.2012 | 185.38 | 76.19 | 109.19 | 143.33% | 161.59 | 23.79 | 14.72% |
| 31.12.2011 | 76.19 | - 472.83 | 549.02 | - 116.11% | 120.23 | -44.04 | -36.63% |
| 30.11.2011 | - 472.83 | 120.63 | - 593.47 | - 491.97% | 178.63 | - 651.46 | - 364.70% |
| 31.10.2011 | 120.63 | 8.99 | 111.64 | 1 241.54% | 276.93 | - 156.30 | -56.44% |
| 30.09.2011 | 8.99 | - 709.43 | 718.42 | - 101.27% | 108.36 | -99.37 | -91.70% |
| 31.08.2011 | - 709.43 | -92.19 | - 617.24 | 669.55% | 10.58 | - 720.01 | -6 807.31% |
| 31.07.2011 | -92.19 | 198.75 | - 290.93 | - 146.38% | 100.65 | - 192.84 | - 191.59% |
| 30.06.2011 | 198.75 | 125.08 | 73.66 | 58.89% | - 162.15 | 360.90 | - 222.57% |
| 31.05.2011 | 125.08 | 16.64 | 108.45 | 651.80% | - 170.35 | 295.44 | - 173.43% |
| 30.04.2011 | 16.64 | -1 565.89 | 1 582.53 | - 101.06% | 107.37 | -90.73 | -84.50% |
| 31.03.2011 | -1 565.89 | 60.11 | -1 626.00 | -2 705.05% | 70.35 | -1 636.24 | -2 325.96% |
| 28.02.2011 | 60.11 | 161.59 | - 101.48 | -62.80% | - 148.70 | 208.81 | - 140.42% |
| 31.01.2011 | 161.59 | 120.23 | 41.37 | 34.41% | 59.38 | 102.21 | 172.12% |
| 31.12.2010 | 120.23 | 178.63 | -58.40 | -32.69% | - 318.00 | 438.22 | - 137.81% |
| 30.11.2010 | 178.63 | 276.93 | -98.31 | -35.50% | 48.85 | 129.78 | 265.66% |
| 31.10.2010 | 276.93 | 108.36 | 168.57 | 155.56% | -47.20 | 324.14 | - 686.69% |
| 30.09.2010 | 108.36 | 10.58 | 97.79 | 924.52% | -52.24 | 160.60 | - 307.45% |
| 31.08.2010 | 10.58 | 100.65 | -90.07 | -89.49% | - 311.42 | 322.00 | - 103.40% |
| 31.07.2010 | 100.65 | - 162.15 | 262.80 | - 162.07% | 43.53 | 57.12 | 131.21% |
| 30.06.2010 | - 162.15 | - 170.35 | 8.20 | -4.81% | - 183.81 | 21.66 | -11.78% |
| 31.05.2010 | - 170.35 | 107.37 | - 277.72 | - 258.66% | - 234.74 | 64.39 | -27.43% |
| 30.04.2010 | 107.37 | 70.35 | 37.02 | 52.63% | -74.08 | 181.45 | - 244.94% |
| 31.03.2010 | 70.35 | - 148.70 | 219.04 | - 147.31% | - 228.02 | 298.37 | - 130.85% |
| 28.02.2010 | - 148.70 | 59.38 | - 208.08 | - 350.40% | - 365.25 | 216.55 | -59.29% |
| 31.01.2010 | 59.38 | - 318.00 | 377.38 | - 118.67% | -16.78 | 76.16 | - 453.87% |
| 31.12.2009 | - 318.00 | 48.85 | - 366.85 | - 750.95% | - | - | - |
| 30.11.2009 | 48.85 | -47.20 | 96.05 | - 203.49% | - | - | - |
| 31.10.2009 | -47.20 | -52.24 | 5.03 | -9.64% | - | - | - |
| 30.09.2009 | -52.24 | - 311.42 | 259.19 | -83.23% | - | - | - |
| 31.08.2009 | - 311.42 | 43.53 | - 354.95 | - 815.41% | - | - | - |
| 31.07.2009 | 43.53 | - 183.81 | 227.34 | - 123.68% | - | - | - |
| 30.06.2009 | - 183.81 | - 234.74 | 50.93 | -21.70% | - | - | - |
| 31.05.2009 | - 234.74 | -74.08 | - 160.66 | 216.87% | - | - | - |
| 30.04.2009 | -74.08 | - 228.02 | 153.94 | -67.51% | - | - | - |
| 31.03.2009 | - 228.02 | - 365.25 | 137.22 | -37.57% | - | - | - |
| 28.02.2009 | - 365.25 | -16.78 | - 348.46 | 2 076.54% | - | - | - |
| 31.01.2009 | -16.78 | - | - | - | - | - | - |
Graf jako obrázek

Podobné sestavy
Aplikace Ekonomika ČNB ze sekce makroekonomika zobrazuje časové řady hlavních makroekonomických údajů z ekonomiky ČR. Najdete zde přes 10.000 grafů různých hodnot od úrokových sazeb, přes statistiky státního rozpočtu, statistiky ČNB a data zpracovávaná ČSÚ. Data jsou k dispozici obvykle za posledních více než 20 let, od prosince roku 1992. Zdroj dat: ČNB ARAD

