Mutual funds shares/units issued (Mixed Funds Balance Sheet - Flows) - ekonomika ČNB
Aktualizace dat Mutual funds shares/units issued (Mixed Funds Balance Sheet - Flows) v této aplikaci skončila 30.6.2023. Aktualizovná data časových řad najdete na stránkách nové aplikace z dat ARAD ČNB
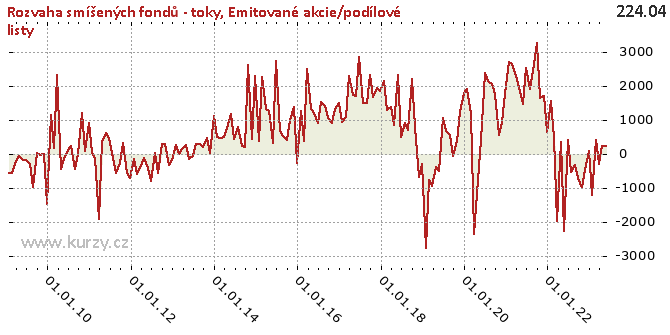
Graf hodnot, Mixed Funds Balance Sheet - Flows
Meziroční srovnání
Minima a maxima
| Typ | Období | Hodnota |
|---|---|---|
| Min | 31.01.2019 | -2 782.70 |
| Max | 30.06.2017 | 2 853.91 |
Historické hodnoty
| Období | Hodnota | Předchozí | Rozdíl | Změna | Před rokem | Rozdíl | Změna |
|---|---|---|---|---|---|---|---|
| 30.06.2020 | 2 388.84 | 222.27 | 2 166.57 | 974.73% | 1 048.06 | 1 340.78 | 127.93% |
| 31.05.2020 | 222.27 | - 730.36 | 952.64 | - 130.43% | - 507.38 | 729.65 | - 143.81% |
| 30.04.2020 | - 730.36 | -2 327.73 | 1 597.37 | -68.62% | - 395.34 | - 335.02 | 84.74% |
| 31.03.2020 | -2 327.73 | 1 181.90 | -3 509.63 | - 296.95% | - 938.14 | -1 389.59 | 148.12% |
| 29.02.2020 | 1 181.90 | 1 926.51 | - 744.61 | -38.65% | - 761.26 | 1 943.16 | - 255.26% |
| 31.01.2020 | 1 926.51 | 2 212.27 | - 285.76 | -12.92% | -2 782.70 | 4 709.22 | - 169.23% |
| 31.12.2019 | 2 212.27 | 1 225.23 | 987.04 | 80.56% | - 303.53 | 2 515.80 | - 828.85% |
| 30.11.2019 | 1 225.23 | 371.00 | 854.23 | 230.25% | - 680.08 | 1 905.31 | - 280.16% |
| 31.10.2019 | 371.00 | -74.27 | 445.27 | - 599.52% | 793.56 | - 422.56 | -53.25% |
| 30.09.2019 | -74.27 | 540.11 | - 614.38 | - 113.75% | 2 186.92 | -2 261.19 | - 103.40% |
| 31.08.2019 | 540.11 | 654.91 | - 114.80 | -17.53% | 705.42 | - 165.31 | -23.43% |
| 31.07.2019 | 654.91 | 1 048.06 | - 393.14 | -37.51% | 916.24 | - 261.33 | -28.52% |
| 30.06.2019 | 1 048.06 | - 507.38 | 1 555.43 | - 306.56% | 486.00 | 562.05 | 115.65% |
| 31.05.2019 | - 507.38 | - 395.34 | - 112.04 | 28.34% | 2 312.37 | -2 819.74 | - 121.94% |
| 30.04.2019 | - 395.34 | - 938.14 | 542.80 | -57.86% | 837.34 | -1 232.68 | - 147.21% |
| 31.03.2019 | - 938.14 | - 761.26 | - 176.88 | 23.24% | 1 367.45 | -2 305.59 | - 168.60% |
| 28.02.2019 | - 761.26 | -2 782.70 | 2 021.44 | -72.64% | 1 286.62 | -2 047.87 | - 159.17% |
| 31.01.2019 | -2 782.70 | - 303.53 | -2 479.17 | 816.78% | 2 140.16 | -4 922.86 | - 230.02% |
| 31.12.2018 | - 303.53 | - 680.08 | 376.55 | -55.37% | 1 843.00 | -2 146.53 | - 116.47% |
| 30.11.2018 | - 680.08 | 793.56 | -1 473.63 | - 185.70% | 1 941.95 | -2 622.03 | - 135.02% |
| 31.10.2018 | 793.56 | 2 186.92 | -1 393.37 | -63.71% | 1 663.17 | - 869.61 | -52.29% |
| 30.09.2018 | 2 186.92 | 705.42 | 1 481.50 | 210.01% | 2 323.89 | - 136.97 | -5.89% |
| 31.08.2018 | 705.42 | 916.24 | - 210.82 | -23.01% | 1 478.22 | - 772.80 | -52.28% |
| 31.07.2018 | 916.24 | 486.00 | 430.24 | 88.53% | 1 490.57 | - 574.33 | -38.53% |
| 30.06.2018 | 486.00 | 2 312.37 | -1 826.36 | -78.98% | 2 853.91 | -2 367.91 | -82.97% |
| 31.05.2018 | 2 312.37 | 837.34 | 1 475.02 | 176.15% | 1 681.86 | 630.50 | 37.49% |
| 30.04.2018 | 837.34 | 1 367.45 | - 530.10 | -38.77% | 1 726.29 | - 888.94 | -51.49% |
| 31.03.2018 | 1 367.45 | 1 286.62 | 80.83 | 6.28% | 2 277.84 | - 910.40 | -39.97% |
| 28.02.2018 | 1 286.62 | 2 140.16 | - 853.54 | -39.88% | 1 065.92 | 220.69 | 20.70% |
| 31.01.2018 | 2 140.16 | 1 843.00 | 297.16 | 16.12% | 927.98 | 1 212.19 | 130.63% |
| 31.12.2017 | 1 843.00 | 1 941.95 | -98.95 | -5.10% | 1 491.26 | 351.74 | 23.59% |
| 30.11.2017 | 1 941.95 | 1 663.17 | 278.78 | 16.76% | 1 303.00 | 638.95 | 49.04% |
| 31.10.2017 | 1 663.17 | 2 323.89 | - 660.72 | -28.43% | 912.67 | 750.50 | 82.23% |
| 30.09.2017 | 2 323.89 | 1 478.22 | 845.67 | 57.21% | 1 034.41 | 1 289.48 | 124.66% |
| 31.08.2017 | 1 478.22 | 1 490.57 | -12.35 | -0.83% | 1 410.43 | 67.79 | 4.81% |
| 31.07.2017 | 1 490.57 | 2 853.91 | -1 363.34 | -47.77% | 1 506.54 | -15.97 | -1.06% |
| 30.06.2017 | 2 853.91 | 1 681.86 | 1 172.05 | 69.69% | 901.05 | 1 952.86 | 216.73% |
| 31.05.2017 | 1 681.86 | 1 726.29 | -44.42 | -2.57% | 1 184.57 | 497.29 | 41.98% |
| 30.04.2017 | 1 726.29 | 2 277.84 | - 551.56 | -24.21% | 1 310.71 | 415.58 | 31.71% |
| 31.03.2017 | 2 277.84 | 1 065.92 | 1 211.92 | 113.70% | 2 496.09 | - 218.24 | -8.74% |
| 28.02.2017 | 1 065.92 | 927.98 | 137.95 | 14.87% | 366.51 | 699.42 | 190.83% |
| 31.01.2017 | 927.98 | 1 491.26 | - 563.29 | -37.77% | 1 243.36 | - 315.38 | -25.37% |
| 31.12.2016 | 1 491.26 | 1 303.00 | 188.26 | 14.45% | - 265.61 | 1 756.87 | - 661.45% |
| 30.11.2016 | 1 303.00 | 912.67 | 390.33 | 42.77% | 1 365.48 | -62.48 | -4.58% |
| 31.10.2016 | 912.67 | 1 034.41 | - 121.74 | -11.77% | 982.00 | -69.33 | -7.06% |
| 30.09.2016 | 1 034.41 | 1 410.43 | - 376.02 | -26.66% | 408.03 | 626.38 | 153.51% |
| 31.08.2016 | 1 410.43 | 1 506.54 | -96.11 | -6.38% | 514.82 | 895.61 | 173.96% |
| 31.07.2016 | 1 506.54 | 901.05 | 605.50 | 67.20% | 659.93 | 846.61 | 128.29% |
| 30.06.2016 | 901.05 | 1 184.57 | - 283.52 | -23.93% | 2 721.23 | -1 820.18 | -66.89% |
| 31.05.2016 | 1 184.57 | 1 310.71 | - 126.14 | -9.62% | 314.98 | 869.59 | 276.08% |
| 30.04.2016 | 1 310.71 | 2 496.09 | -1 185.38 | -47.49% | 1 267.60 | 43.11 | 3.40% |
| 31.03.2016 | 2 496.09 | 366.51 | 2 129.58 | 581.05% | 1 302.23 | 1 193.85 | 91.68% |
| 29.02.2016 | 366.51 | 1 243.36 | - 876.85 | -70.52% | 2 241.25 | -1 874.75 | -83.65% |
| 31.01.2016 | 1 243.36 | - 265.61 | 1 508.96 | - 568.12% | 374.59 | 868.76 | 231.92% |
| 31.12.2015 | - 265.61 | 1 365.48 | -1 631.09 | - 119.45% | 2 277.35 | -2 542.95 | - 111.66% |
| 30.11.2015 | 1 365.48 | 982.00 | 383.49 | 39.05% | 421.69 | 943.79 | 223.81% |
| 31.10.2015 | 982.00 | 408.03 | 573.97 | 140.67% | 2 612.87 | -1 630.88 | -62.42% |
| 30.09.2015 | 408.03 | 514.82 | - 106.79 | -20.74% | 206.36 | 201.67 | 97.73% |
| 31.08.2015 | 514.82 | 659.93 | - 145.11 | -21.99% | 231.53 | 283.29 | 122.35% |
| 31.07.2015 | 659.93 | 2 721.23 | -2 061.30 | -75.75% | 792.99 | - 133.06 | -16.78% |
| 30.06.2015 | 2 721.23 | 314.98 | 2 406.25 | 763.94% | 440.66 | 2 280.57 | 517.53% |
| 31.05.2015 | 314.98 | 1 267.60 | - 952.62 | -75.15% | 1 171.47 | - 856.50 | -73.11% |
| 30.04.2015 | 1 267.60 | 1 302.23 | -34.64 | -2.66% | 758.27 | 509.33 | 67.17% |
| 31.03.2015 | 1 302.23 | 2 241.25 | - 939.02 | -41.90% | 491.10 | 811.14 | 165.17% |
| 28.02.2015 | 2 241.25 | 374.59 | 1 866.66 | 498.32% | 463.17 | 1 778.08 | 383.89% |
| 31.01.2015 | 374.59 | 2 277.35 | -1 902.75 | -83.55% | 476.90 | - 102.30 | -21.45% |
| 31.12.2014 | 2 277.35 | 421.69 | 1 855.65 | 440.05% | 1 114.71 | 1 162.64 | 104.30% |
| 30.11.2014 | 421.69 | 2 612.87 | -2 191.18 | -83.86% | 7.54 | 414.15 | 5 490.52% |
| 31.10.2014 | 2 612.87 | 206.36 | 2 406.51 | 1 166.17% | 448.92 | 2 163.95 | 482.04% |
| 30.09.2014 | 206.36 | 231.53 | -25.17 | -10.87% | 189.29 | 17.07 | 9.02% |
| 31.08.2014 | 231.53 | 792.99 | - 561.46 | -70.80% | 284.22 | -52.69 | -18.54% |
| 31.07.2014 | 792.99 | 440.66 | 352.33 | 79.96% | 275.39 | 517.60 | 187.95% |
| 30.06.2014 | 440.66 | 1 171.47 | - 730.82 | -62.38% | -56.08 | 496.74 | - 885.84% |
| 31.05.2014 | 1 171.47 | 758.27 | 413.21 | 54.49% | - 157.17 | 1 328.64 | - 845.36% |
| 30.04.2014 | 758.27 | 491.10 | 267.17 | 54.40% | 263.47 | 494.80 | 187.80% |
| 31.03.2014 | 491.10 | 463.17 | 27.93 | 6.03% | 140.29 | 350.81 | 250.06% |
| 28.02.2014 | 463.17 | 476.90 | -13.73 | -2.88% | -5.89 | 469.06 | -7 966.34% |
| 31.01.2014 | 476.90 | 1 114.71 | - 637.81 | -57.22% | 254.50 | 222.39 | 87.38% |
| 31.12.2013 | 1 114.71 | 7.54 | 1 107.17 | 14 678.07% | - 191.92 | 1 306.63 | - 680.83% |
| 30.11.2013 | 7.54 | 448.92 | - 441.37 | -98.32% | - 335.30 | 342.84 | - 102.25% |
| 31.10.2013 | 448.92 | 189.29 | 259.63 | 137.16% | 290.64 | 158.28 | 54.46% |
| 30.09.2013 | 189.29 | 284.22 | -94.93 | -33.40% | 278.70 | -89.41 | -32.08% |
| 31.08.2013 | 284.22 | 275.39 | 8.83 | 3.21% | - 562.52 | 846.74 | - 150.53% |
| 31.07.2013 | 275.39 | -56.08 | 331.47 | - 591.12% | 12.97 | 262.42 | 2 022.66% |
| 30.06.2013 | -56.08 | - 157.17 | 101.09 | -64.32% | - 812.83 | 756.75 | -93.10% |
| 31.05.2013 | - 157.17 | 263.47 | - 420.64 | - 159.65% | - 413.13 | 255.96 | -61.96% |
| 30.04.2013 | 263.47 | 140.29 | 123.18 | 87.81% | - 129.04 | 392.51 | - 304.18% |
| 31.03.2013 | 140.29 | -5.89 | 146.18 | -2 482.63% | - 368.94 | 509.23 | - 138.02% |
| 28.02.2013 | -5.89 | 254.50 | - 260.39 | - 102.31% | - 610.34 | 604.45 | -99.04% |
| 31.01.2013 | 254.50 | - 191.92 | 446.42 | - 232.61% | - 146.89 | 401.39 | - 273.26% |
| 31.12.2012 | - 191.92 | - 335.30 | 143.38 | -42.76% | - 727.38 | 535.46 | -73.62% |
| 30.11.2012 | - 335.30 | 290.64 | - 625.94 | - 215.37% | - 579.06 | 243.76 | -42.10% |
| 31.10.2012 | 290.64 | 278.70 | 11.94 | 4.28% | 311.05 | -20.41 | -6.56% |
| 30.09.2012 | 278.70 | - 562.52 | 841.22 | - 149.54% | - 269.26 | 547.96 | - 203.50% |
| 31.08.2012 | - 562.52 | 12.97 | - 575.49 | -4 435.73% | - 560.42 | -2.10 | 0.37% |
| 31.07.2012 | 12.97 | - 812.83 | 825.80 | - 101.60% | - 111.67 | 124.64 | - 111.62% |
| 30.06.2012 | - 812.83 | - 413.13 | - 399.69 | 96.75% | 468.13 | -1 280.96 | - 273.63% |
| 31.05.2012 | - 413.13 | - 129.04 | - 284.09 | 220.16% | 594.13 | -1 007.26 | - 169.54% |
| 30.04.2012 | - 129.04 | - 368.94 | 239.90 | -65.02% | 345.20 | - 474.24 | - 137.38% |
| 31.03.2012 | - 368.94 | - 610.34 | 241.39 | -39.55% | -1 918.35 | 1 549.40 | -80.77% |
| 29.02.2012 | - 610.34 | - 146.89 | - 463.45 | 315.51% | - 140.33 | - 470.00 | 334.92% |
| 31.01.2012 | - 146.89 | - 727.38 | 580.49 | -79.81% | 19.79 | - 166.68 | - 842.31% |
| 31.12.2011 | - 727.38 | - 579.06 | - 148.31 | 25.61% | 900.24 | -1 627.61 | - 180.80% |
| 30.11.2011 | - 579.06 | 311.05 | - 890.11 | - 286.17% | 69.27 | - 648.33 | - 935.99% |
| 31.10.2011 | 311.05 | - 269.26 | 580.31 | - 215.52% | 1 192.74 | - 881.69 | -73.92% |
| 30.09.2011 | - 269.26 | - 560.42 | 291.16 | -51.95% | 3.32 | - 272.58 | -8 200.51% |
| 31.08.2011 | - 560.42 | - 111.67 | - 448.76 | 401.88% | - 445.04 | - 115.38 | 25.93% |
| 31.07.2011 | - 111.67 | 468.13 | - 579.80 | - 123.85% | 233.85 | - 345.51 | - 147.75% |
| 30.06.2011 | 468.13 | 594.13 | - 126.00 | -21.21% | 97.79 | 370.35 | 378.72% |
| 31.05.2011 | 594.13 | 345.20 | 248.93 | 72.11% | - 149.05 | 743.18 | - 498.62% |
| 30.04.2011 | 345.20 | -1 918.35 | 2 263.55 | - 117.99% | - 453.03 | 798.23 | - 176.20% |
| 31.03.2011 | -1 918.35 | - 140.33 | -1 778.01 | 1 267.00% | 2 305.72 | -4 224.06 | - 183.20% |
| 28.02.2011 | - 140.33 | 19.79 | - 160.12 | - 809.18% | 167.64 | - 307.97 | - 183.71% |
| 31.01.2011 | 19.79 | 900.24 | - 880.45 | -97.80% | 1 143.47 | -1 123.68 | -98.27% |
| 31.12.2010 | 900.24 | 69.27 | 830.97 | 1 199.66% | -1 474.19 | 2 374.43 | - 161.07% |
| 30.11.2010 | 69.27 | 1 192.74 | -1 123.47 | -94.19% | 0.13 | 69.13 | 51 591.79% |
| 31.10.2010 | 1 192.74 | 3.32 | 1 189.41 | 35 782.55% | -43.97 | 1 236.70 | -2 812.74% |
| 30.09.2010 | 3.32 | - 445.04 | 448.37 | - 100.75% | 33.51 | -30.18 | -90.08% |
| 31.08.2010 | - 445.04 | 233.85 | - 678.89 | - 290.31% | - 980.07 | 535.03 | -54.59% |
| 31.07.2010 | 233.85 | 97.79 | 136.06 | 139.14% | - 300.05 | 533.90 | - 177.93% |
| 30.06.2010 | 97.79 | - 149.05 | 246.84 | - 165.61% | - 173.11 | 270.90 | - 156.49% |
| 31.05.2010 | - 149.05 | - 453.03 | 303.98 | -67.10% | - 191.73 | 42.69 | -22.26% |
| 30.04.2010 | - 453.03 | 2 305.72 | -2 758.74 | - 119.65% | -60.18 | - 392.85 | 652.81% |
| 31.03.2010 | 2 305.72 | 167.64 | 2 138.08 | 1 275.41% | - 217.52 | 2 523.24 | -1 160.00% |
| 28.02.2010 | 167.64 | 1 143.47 | - 975.83 | -85.34% | - 580.90 | 748.54 | - 128.86% |
| 31.01.2010 | 1 143.47 | -1 474.19 | 2 617.66 | - 177.57% | - 579.17 | 1 722.64 | - 297.43% |
| 31.12.2009 | -1 474.19 | 0.13 | -1 474.32 | -1 100 238.81% | - | - | - |
| 30.11.2009 | 0.13 | -43.97 | 44.10 | - 100.30% | - | - | - |
| 31.10.2009 | -43.97 | 33.51 | -77.48 | - 231.22% | - | - | - |
| 30.09.2009 | 33.51 | - 980.07 | 1 013.58 | - 103.42% | - | - | - |
| 31.08.2009 | - 980.07 | - 300.05 | - 680.01 | 226.63% | - | - | - |
| 31.07.2009 | - 300.05 | - 173.11 | - 126.95 | 73.33% | - | - | - |
| 30.06.2009 | - 173.11 | - 191.73 | 18.63 | -9.71% | - | - | - |
| 31.05.2009 | - 191.73 | -60.18 | - 131.56 | 218.61% | - | - | - |
| 30.04.2009 | -60.18 | - 217.52 | 157.34 | -72.33% | - | - | - |
| 31.03.2009 | - 217.52 | - 580.90 | 363.38 | -62.55% | - | - | - |
| 28.02.2009 | - 580.90 | - 579.17 | -1.73 | 0.30% | - | - | - |
| 31.01.2009 | - 579.17 | - | - | - | - | - | - |
Graf jako obrázek

Podobné sestavy
Aplikace Ekonomika ČNB ze sekce makroekonomika zobrazuje časové řady hlavních makroekonomických údajů z ekonomiky ČR. Najdete zde přes 10.000 grafů různých hodnot od úrokových sazeb, přes statistiky státního rozpočtu, statistiky ČNB a data zpracovávaná ČSÚ. Data jsou k dispozici obvykle za posledních více než 20 let, od prosince roku 1992. Zdroj dat: ČNB ARAD

