Other assets (Mixed Funds Balance Sheet - Flows) - ekonomika ČNB
Aktualizace dat Other assets (Mixed Funds Balance Sheet - Flows) v této aplikaci skončila 30.6.2023. Aktualizovná data časových řad najdete na stránkách nové aplikace z dat ARAD ČNB
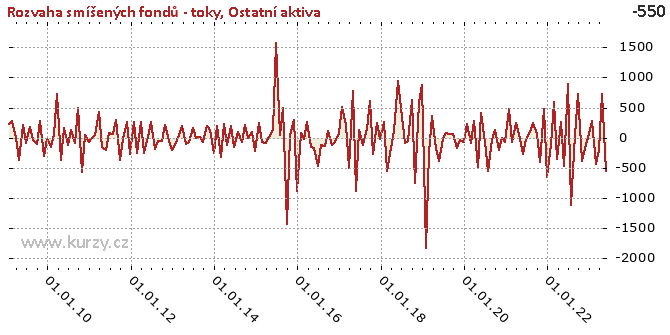
Graf hodnot, Mixed Funds Balance Sheet - Flows
Meziroční srovnání
Minima a maxima
| Typ | Období | Hodnota |
|---|---|---|
| Min | 31.01.2019 | -1 836.00 |
| Max | 30.06.2015 | 1 577.39 |
Historické hodnoty
| Období | Hodnota | Předchozí | Rozdíl | Změna | Před rokem | Rozdíl | Změna |
|---|---|---|---|---|---|---|---|
| 30.06.2020 | -73.13 | 412.23 | - 485.36 | - 117.74% | -15.68 | -57.45 | 366.29% |
| 31.05.2020 | 412.23 | - 500.36 | 912.60 | - 182.39% | - 388.95 | 801.18 | - 205.99% |
| 30.04.2020 | - 500.36 | 278.25 | - 778.62 | - 279.82% | - 191.39 | - 308.97 | 161.43% |
| 31.03.2020 | 278.25 | - 102.29 | 380.54 | - 372.03% | 354.26 | -76.01 | -21.46% |
| 29.02.2020 | - 102.29 | 240.82 | - 343.11 | - 142.47% | - 261.21 | 158.92 | -60.84% |
| 31.01.2020 | 240.82 | -71.18 | 312.00 | - 438.31% | -1 836.00 | 2 076.82 | - 113.12% |
| 31.12.2019 | -71.18 | -46.28 | -24.90 | 53.80% | 867.68 | - 938.86 | - 108.20% |
| 30.11.2019 | -46.28 | - 169.82 | 123.54 | -72.75% | 569.86 | - 616.14 | - 108.12% |
| 31.10.2019 | - 169.82 | 68.68 | - 238.50 | - 347.26% | - 755.98 | 586.16 | -77.54% |
| 30.09.2019 | 68.68 | 63.56 | 5.12 | 8.06% | 622.49 | - 553.81 | -88.97% |
| 31.08.2019 | 63.56 | 71.90 | -8.34 | -11.60% | -49.81 | 113.37 | - 227.62% |
| 31.07.2019 | 71.90 | -15.68 | 87.58 | - 558.46% | -84.73 | 156.63 | - 184.86% |
| 30.06.2019 | -15.68 | - 388.95 | 373.27 | -95.97% | 488.52 | - 504.20 | - 103.21% |
| 31.05.2019 | - 388.95 | - 191.39 | - 197.56 | 103.22% | 947.28 | -1 336.23 | - 141.06% |
| 30.04.2019 | - 191.39 | 354.26 | - 545.66 | - 154.03% | 103.72 | - 295.11 | - 284.54% |
| 31.03.2019 | 354.26 | - 261.21 | 615.48 | - 235.62% | - 173.35 | 527.62 | - 304.36% |
| 28.02.2019 | - 261.21 | -1 836.00 | 1 574.79 | -85.77% | - 543.92 | 282.71 | -51.98% |
| 31.01.2019 | -1 836.00 | 867.68 | -2 703.68 | - 311.60% | 259.83 | -2 095.84 | - 806.61% |
| 31.12.2018 | 867.68 | 569.86 | 297.82 | 52.26% | -29.25 | 896.93 | -3 066.53% |
| 30.11.2018 | 569.86 | - 755.98 | 1 325.84 | - 175.38% | 244.77 | 325.08 | 132.81% |
| 31.10.2018 | - 755.98 | 622.49 | -1 378.47 | - 221.44% | - 272.51 | - 483.47 | 177.42% |
| 30.09.2018 | 622.49 | -49.81 | 672.30 | -1 349.83% | 604.03 | 18.46 | 3.06% |
| 31.08.2018 | -49.81 | -84.73 | 34.92 | -41.22% | 145.73 | - 195.53 | - 134.18% |
| 31.07.2018 | -84.73 | 488.52 | - 573.25 | - 117.34% | - 119.82 | 35.09 | -29.29% |
| 30.06.2018 | 488.52 | 947.28 | - 458.76 | -48.43% | 128.47 | 360.05 | 280.25% |
| 31.05.2018 | 947.28 | 103.72 | 843.57 | 813.35% | - 875.75 | 1 823.03 | - 208.17% |
| 30.04.2018 | 103.72 | - 173.35 | 277.07 | - 159.83% | 779.25 | - 675.54 | -86.69% |
| 31.03.2018 | - 173.35 | - 543.92 | 370.56 | -68.13% | - 498.75 | 325.40 | -65.24% |
| 28.02.2018 | - 543.92 | 259.83 | - 803.75 | - 309.33% | 215.77 | - 759.68 | - 352.08% |
| 31.01.2018 | 259.83 | -29.25 | 289.08 | - 988.34% | 517.39 | - 257.56 | -49.78% |
| 31.12.2017 | -29.25 | 244.77 | - 274.02 | - 111.95% | 85.88 | - 115.13 | - 134.06% |
| 30.11.2017 | 244.77 | - 272.51 | 517.28 | - 189.82% | -77.78 | 322.55 | - 414.70% |
| 31.10.2017 | - 272.51 | 604.03 | - 876.53 | - 145.12% | - 116.52 | - 155.99 | 133.87% |
| 30.09.2017 | 604.03 | 145.73 | 458.30 | 314.50% | 113.16 | 490.87 | 433.79% |
| 31.08.2017 | 145.73 | - 119.82 | 265.55 | - 221.62% | - 134.69 | 280.42 | - 208.19% |
| 31.07.2017 | - 119.82 | 128.47 | - 248.30 | - 193.27% | - 118.43 | -1.39 | 1.17% |
| 30.06.2017 | 128.47 | - 875.75 | 1 004.22 | - 114.67% | - 461.49 | 589.96 | - 127.84% |
| 31.05.2017 | - 875.75 | 779.25 | -1 655.00 | - 212.38% | - 163.87 | - 711.88 | 434.41% |
| 30.04.2017 | 779.25 | - 498.75 | 1 278.01 | - 256.24% | - 151.24 | 930.50 | - 615.23% |
| 31.03.2017 | - 498.75 | 215.77 | - 714.52 | - 331.15% | 263.88 | - 762.63 | - 289.01% |
| 28.02.2017 | 215.77 | 517.39 | - 301.62 | -58.30% | -28.07 | 243.84 | - 868.57% |
| 31.01.2017 | 517.39 | 85.88 | 431.51 | 502.46% | 84.31 | 433.08 | 513.70% |
| 31.12.2016 | 85.88 | -77.78 | 163.66 | - 210.41% | - 888.02 | 973.90 | - 109.67% |
| 30.11.2016 | -77.78 | - 116.52 | 38.74 | -33.25% | 287.54 | - 365.32 | - 127.05% |
| 31.10.2016 | - 116.52 | 113.16 | - 229.68 | - 202.97% | 36.16 | - 152.68 | - 422.25% |
| 30.09.2016 | 113.16 | - 134.69 | 247.85 | - 184.01% | -1 427.68 | 1 540.83 | - 107.93% |
| 31.08.2016 | - 134.69 | - 118.43 | -16.26 | 13.73% | 492.52 | - 627.21 | - 127.35% |
| 31.07.2016 | - 118.43 | - 461.49 | 343.06 | -74.34% | 36.94 | - 155.37 | - 420.62% |
| 30.06.2016 | - 461.49 | - 163.87 | - 297.62 | 181.62% | 1 577.39 | -2 038.88 | - 129.26% |
| 31.05.2016 | - 163.87 | - 151.24 | -12.63 | 8.35% | 127.67 | - 291.55 | - 228.35% |
| 30.04.2016 | - 151.24 | 263.88 | - 415.12 | - 157.32% | 17.49 | - 168.73 | - 964.89% |
| 31.03.2016 | 263.88 | -28.07 | 291.95 | -1 039.93% | -92.75 | 356.63 | - 384.49% |
| 29.02.2016 | -28.07 | 84.31 | - 112.38 | - 133.30% | -70.51 | 42.43 | -60.18% |
| 31.01.2016 | 84.31 | - 888.02 | 972.32 | - 109.49% | 237.88 | - 153.57 | -64.56% |
| 31.12.2015 | - 888.02 | 287.54 | -1 175.56 | - 408.83% | - 221.78 | - 666.24 | 300.41% |
| 30.11.2015 | 287.54 | 36.16 | 251.38 | 695.23% | 90.83 | 196.71 | 216.57% |
| 31.10.2015 | 36.16 | -1 427.68 | 1 463.83 | - 102.53% | -10.61 | 46.77 | - 440.70% |
| 30.09.2015 | -1 427.68 | 492.52 | -1 920.19 | - 389.87% | 217.38 | -1 645.06 | - 756.77% |
| 31.08.2015 | 492.52 | 36.94 | 455.58 | 1 233.33% | -76.35 | 568.87 | - 745.05% |
| 31.07.2015 | 36.94 | 1 577.39 | -1 540.45 | -97.66% | 102.78 | -65.84 | -64.06% |
| 30.06.2015 | 1 577.39 | 127.67 | 1 449.71 | 1 135.49% | - 146.91 | 1 724.30 | -1 173.69% |
| 31.05.2015 | 127.67 | 17.49 | 110.19 | 630.10% | 199.98 | -72.31 | -36.16% |
| 30.04.2015 | 17.49 | -92.75 | 110.24 | - 118.85% | - 122.35 | 139.84 | - 114.29% |
| 31.03.2015 | -92.75 | -70.51 | -22.25 | 31.55% | 233.05 | - 325.80 | - 139.80% |
| 28.02.2015 | -70.51 | 237.88 | - 308.38 | - 129.64% | - 312.04 | 241.54 | -77.40% |
| 31.01.2015 | 237.88 | - 221.78 | 459.65 | - 207.26% | 198.93 | 38.95 | 19.58% |
| 31.12.2014 | - 221.78 | 90.83 | - 312.61 | - 344.17% | - 245.46 | 23.69 | -9.65% |
| 30.11.2014 | 90.83 | -10.61 | 101.44 | - 955.83% | 133.19 | -42.36 | -31.80% |
| 31.10.2014 | -10.61 | 217.38 | - 227.99 | - 104.88% | 188.38 | - 199.00 | - 105.63% |
| 30.09.2014 | 217.38 | -76.35 | 293.73 | - 384.70% | -72.88 | 290.26 | - 398.27% |
| 31.08.2014 | -76.35 | 102.78 | - 179.14 | - 174.29% | 7.25 | -83.60 | -1 153.59% |
| 31.07.2014 | 102.78 | - 146.91 | 249.69 | - 169.96% | -4.24 | 107.03 | -2 521.82% |
| 30.06.2014 | - 146.91 | 199.98 | - 346.89 | - 173.46% | 168.87 | - 315.79 | - 187.00% |
| 31.05.2014 | 199.98 | - 122.35 | 322.33 | - 263.45% | -76.43 | 276.41 | - 361.63% |
| 30.04.2014 | - 122.35 | 233.05 | - 355.39 | - 152.50% | - 102.00 | -20.35 | 19.96% |
| 31.03.2014 | 233.05 | - 312.04 | 545.09 | - 174.68% | 193.52 | 39.53 | 20.43% |
| 28.02.2014 | - 312.04 | 198.93 | - 510.97 | - 256.86% | 46.01 | - 358.05 | - 778.25% |
| 31.01.2014 | 198.93 | - 245.46 | 444.39 | - 181.04% | -84.40 | 283.33 | - 335.69% |
| 31.12.2013 | - 245.46 | 133.19 | - 378.65 | - 284.30% | - 208.84 | -36.63 | 17.54% |
| 30.11.2013 | 133.19 | 188.38 | -55.20 | -29.30% | -61.33 | 194.51 | - 317.18% |
| 31.10.2013 | 188.38 | -72.88 | 261.26 | - 358.49% | 218.20 | -29.81 | -13.66% |
| 30.09.2013 | -72.88 | 7.25 | -80.13 | -1 105.64% | -52.92 | -19.96 | 37.72% |
| 31.08.2013 | 7.25 | -4.24 | 11.49 | - 270.76% | -51.27 | 58.51 | - 114.14% |
| 31.07.2013 | -4.24 | 168.87 | - 173.12 | - 102.51% | - 189.32 | 185.07 | -97.76% |
| 30.06.2013 | 168.87 | -76.43 | 245.31 | - 320.94% | 263.76 | -94.89 | -35.98% |
| 31.05.2013 | -76.43 | - 102.00 | 25.56 | -25.06% | 18.42 | -94.86 | - 514.91% |
| 30.04.2013 | - 102.00 | 193.52 | - 295.51 | - 152.71% | - 257.64 | 155.65 | -60.41% |
| 31.03.2013 | 193.52 | 46.01 | 147.51 | 320.63% | 259.59 | -66.07 | -25.45% |
| 28.02.2013 | 46.01 | -84.40 | 130.41 | - 154.51% | - 252.65 | 298.66 | - 118.21% |
| 31.01.2013 | -84.40 | - 208.84 | 124.44 | -59.58% | 264.75 | - 349.16 | - 131.88% |
| 31.12.2012 | - 208.84 | -61.33 | - 147.51 | 240.54% | - 272.30 | 63.46 | -23.30% |
| 30.11.2012 | -61.33 | 218.20 | - 279.52 | - 128.11% | 253.00 | - 314.33 | - 124.24% |
| 31.10.2012 | 218.20 | -52.92 | 271.12 | - 512.31% | -14.32 | 232.51 | -1 623.93% |
| 30.09.2012 | -52.92 | -51.27 | -1.66 | 3.23% | - 375.98 | 323.06 | -85.92% |
| 31.08.2012 | -51.27 | - 189.32 | 138.05 | -72.92% | 295.90 | - 347.17 | - 117.32% |
| 31.07.2012 | - 189.32 | 263.76 | - 453.08 | - 171.77% | 55.90 | - 245.21 | - 438.69% |
| 30.06.2012 | 263.76 | 18.42 | 245.34 | 1 331.79% | 72.49 | 191.27 | 263.84% |
| 31.05.2012 | 18.42 | - 257.64 | 276.07 | - 107.15% | - 201.09 | 219.51 | - 109.16% |
| 30.04.2012 | - 257.64 | 259.59 | - 517.24 | - 199.25% | - 155.73 | - 101.91 | 65.44% |
| 31.03.2012 | 259.59 | - 252.65 | 512.25 | - 202.75% | 420.89 | - 161.30 | -38.32% |
| 29.02.2012 | - 252.65 | 264.75 | - 517.41 | - 195.43% | 39.40 | - 292.05 | - 741.27% |
| 31.01.2012 | 264.75 | - 272.30 | 537.05 | - 197.23% | -0.03 | 264.79 | - 802 387.88% |
| 31.12.2011 | - 272.30 | 253.00 | - 525.30 | - 207.63% | -74.22 | - 198.07 | 266.86% |
| 30.11.2011 | 253.00 | -14.32 | 267.32 | -1 867.02% | 52.65 | 200.35 | 380.52% |
| 31.10.2011 | -14.32 | - 375.98 | 361.66 | -96.19% | - 570.46 | 556.14 | -97.49% |
| 30.09.2011 | - 375.98 | 295.90 | - 671.89 | - 227.06% | 490.90 | - 866.89 | - 176.59% |
| 31.08.2011 | 295.90 | 55.90 | 240.01 | 429.38% | -89.35 | 385.26 | - 431.16% |
| 31.07.2011 | 55.90 | 72.49 | -16.60 | -22.89% | 132.53 | -76.63 | -57.82% |
| 30.06.2011 | 72.49 | - 201.09 | 273.59 | - 136.05% | - 117.71 | 190.20 | - 161.59% |
| 31.05.2011 | - 201.09 | - 155.73 | -45.36 | 29.13% | 166.96 | - 368.05 | - 220.44% |
| 30.04.2011 | - 155.73 | 420.89 | - 576.62 | - 137.00% | - 371.70 | 215.97 | -58.10% |
| 31.03.2011 | 420.89 | 39.40 | 381.49 | 968.28% | 731.87 | - 310.98 | -42.49% |
| 28.02.2011 | 39.40 | -0.03 | 39.43 | - 119 490.91% | 56.65 | -17.25 | -30.45% |
| 31.01.2011 | -0.03 | -74.22 | 74.19 | -99.96% | - 153.36 | 153.33 | -99.98% |
| 31.12.2010 | -74.22 | 52.65 | - 126.88 | - 240.97% | -27.27 | -46.96 | 172.21% |
| 30.11.2010 | 52.65 | - 570.46 | 623.11 | - 109.23% | - 295.53 | 348.18 | - 117.82% |
| 31.10.2010 | - 570.46 | 490.90 | -1 061.36 | - 216.21% | 271.54 | - 842.00 | - 310.08% |
| 30.09.2010 | 490.90 | -89.35 | 580.26 | - 649.40% | - 111.50 | 602.41 | - 540.27% |
| 31.08.2010 | -89.35 | 132.53 | - 221.88 | - 167.42% | -33.32 | -56.03 | 168.17% |
| 31.07.2010 | 132.53 | - 117.71 | 250.24 | - 212.59% | 180.50 | -47.97 | -26.58% |
| 30.06.2010 | - 117.71 | 166.96 | - 284.67 | - 170.50% | -92.81 | -24.89 | 26.82% |
| 31.05.2010 | 166.96 | - 371.70 | 538.66 | - 144.92% | 204.09 | -37.13 | -18.19% |
| 30.04.2010 | - 371.70 | 731.87 | -1 103.57 | - 150.79% | - 364.59 | -7.10 | 1.95% |
| 31.03.2010 | 731.87 | 56.65 | 675.23 | 1 192.01% | -7.09 | 738.97 | -10 418.23% |
| 28.02.2010 | 56.65 | - 153.36 | 210.01 | - 136.94% | 275.99 | - 219.34 | -79.48% |
| 31.01.2010 | - 153.36 | -27.27 | - 126.10 | 462.45% | 220.19 | - 373.55 | - 169.65% |
| 31.12.2009 | -27.27 | - 295.53 | 268.26 | -90.77% | - | - | - |
| 30.11.2009 | - 295.53 | 271.54 | - 567.07 | - 208.83% | - | - | - |
| 31.10.2009 | 271.54 | - 111.50 | 383.05 | - 343.53% | - | - | - |
| 30.09.2009 | - 111.50 | -33.32 | -78.18 | 234.64% | - | - | - |
| 31.08.2009 | -33.32 | 180.50 | - 213.82 | - 118.46% | - | - | - |
| 31.07.2009 | 180.50 | -92.81 | 273.32 | - 294.48% | - | - | - |
| 30.06.2009 | -92.81 | 204.09 | - 296.90 | - 145.48% | - | - | - |
| 31.05.2009 | 204.09 | - 364.59 | 568.68 | - 155.98% | - | - | - |
| 30.04.2009 | - 364.59 | -7.09 | - 357.50 | 5 040.19% | - | - | - |
| 31.03.2009 | -7.09 | 275.99 | - 283.08 | - 102.57% | - | - | - |
| 28.02.2009 | 275.99 | 220.19 | 55.80 | 25.34% | - | - | - |
| 31.01.2009 | 220.19 | - | - | - | - | - | - |
Graf jako obrázek

Podobné sestavy
Aplikace Ekonomika ČNB ze sekce makroekonomika zobrazuje časové řady hlavních makroekonomických údajů z ekonomiky ČR. Najdete zde přes 10.000 grafů různých hodnot od úrokových sazeb, přes statistiky státního rozpočtu, statistiky ČNB a data zpracovávaná ČSÚ. Data jsou k dispozici obvykle za posledních více než 20 let, od prosince roku 1992. Zdroj dat: ČNB ARAD

