Shares and other equities (Mixed Funds Balance Sheet - Flows) - ekonomika ČNB
Aktualizace dat Shares and other equities (Mixed Funds Balance Sheet - Flows) v této aplikaci skončila 30.6.2023. Aktualizovná data časových řad najdete na stránkách nové aplikace z dat ARAD ČNB
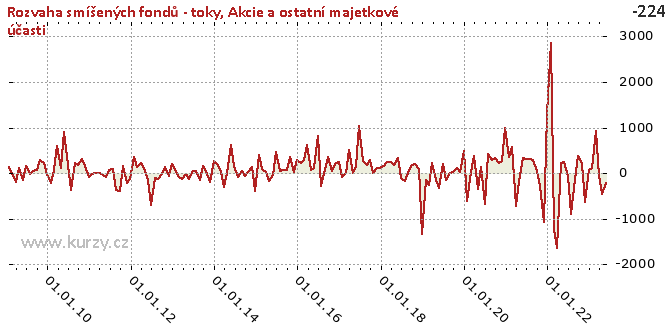
Graf hodnot, Mixed Funds Balance Sheet - Flows
Meziroční srovnání
Minima a maxima
| Typ | Období | Hodnota |
|---|---|---|
| Min | 31.12.2018 | -1 328.82 |
| Max | 30.06.2017 | 1 037.43 |
Historické hodnoty
| Období | Hodnota | Předchozí | Rozdíl | Změna | Před rokem | Rozdíl | Změna |
|---|---|---|---|---|---|---|---|
| 30.06.2020 | - 669.50 | 107.37 | - 776.87 | - 723.55% | 193.82 | - 863.32 | - 445.42% |
| 31.05.2020 | 107.37 | - 332.68 | 440.05 | - 132.27% | - 318.29 | 425.66 | - 133.73% |
| 30.04.2020 | - 332.68 | 370.92 | - 703.60 | - 189.69% | - 155.19 | - 177.49 | 114.37% |
| 31.03.2020 | 370.92 | 30.98 | 339.94 | 1 097.18% | 222.18 | 148.74 | 66.95% |
| 29.02.2020 | 30.98 | - 598.73 | 629.71 | - 105.17% | - 259.48 | 290.46 | - 111.94% |
| 31.01.2020 | - 598.73 | 512.58 | -1 111.31 | - 216.81% | - 148.70 | - 450.03 | 302.65% |
| 31.12.2019 | 512.58 | 32.81 | 479.76 | 1 462.07% | -1 328.82 | 1 841.40 | - 138.57% |
| 30.11.2019 | 32.81 | 124.19 | -91.38 | -73.58% | 99.62 | -66.80 | -67.06% |
| 31.10.2019 | 124.19 | 27.82 | 96.37 | 346.42% | 200.39 | -76.19 | -38.02% |
| 30.09.2019 | 27.82 | -2.76 | 30.58 | -1 109.07% | 171.91 | - 144.09 | -83.82% |
| 31.08.2019 | -2.76 | - 139.87 | 137.11 | -98.03% | 1.55 | -4.31 | - 277.53% |
| 31.07.2019 | - 139.87 | 193.82 | - 333.69 | - 172.16% | - 164.66 | 24.79 | -15.06% |
| 30.06.2019 | 193.82 | - 318.29 | 512.11 | - 160.89% | -96.12 | 289.94 | - 301.64% |
| 31.05.2019 | - 318.29 | - 155.19 | - 163.10 | 105.09% | 339.98 | - 658.26 | - 193.62% |
| 30.04.2019 | - 155.19 | 222.18 | - 377.37 | - 169.85% | 183.65 | - 338.84 | - 184.51% |
| 31.03.2019 | 222.18 | - 259.48 | 481.65 | - 185.63% | 241.55 | -19.37 | -8.02% |
| 28.02.2019 | - 259.48 | - 148.70 | - 110.78 | 74.50% | 249.28 | - 508.76 | - 204.09% |
| 31.01.2019 | - 148.70 | -1 328.82 | 1 180.12 | -88.81% | 155.96 | - 304.66 | - 195.34% |
| 31.12.2018 | -1 328.82 | 99.62 | -1 428.44 | -1 433.94% | 119.25 | -1 448.07 | -1 214.30% |
| 30.11.2018 | 99.62 | 200.39 | - 100.77 | -50.29% | 107.13 | -7.51 | -7.01% |
| 31.10.2018 | 200.39 | 171.91 | 28.48 | 16.57% | -3.42 | 203.81 | -5 954.10% |
| 30.09.2018 | 171.91 | 1.55 | 170.36 | 10 969.48% | 285.43 | - 113.53 | -39.77% |
| 31.08.2018 | 1.55 | - 164.66 | 166.22 | - 100.94% | 179.25 | - 177.70 | -99.13% |
| 31.07.2018 | - 164.66 | -96.12 | -68.54 | 71.31% | 269.06 | - 433.72 | - 161.20% |
| 30.06.2018 | -96.12 | 339.98 | - 436.10 | - 128.27% | 1 037.43 | -1 133.55 | - 109.27% |
| 31.05.2018 | 339.98 | 183.65 | 156.33 | 85.13% | 158.44 | 181.53 | 114.57% |
| 30.04.2018 | 183.65 | 241.55 | -57.91 | -23.97% | -1.99 | 185.64 | -9 328.44% |
| 31.03.2018 | 241.55 | 249.28 | -7.73 | -3.10% | 515.53 | - 273.98 | -53.14% |
| 28.02.2018 | 249.28 | 155.96 | 93.32 | 59.84% | -2.98 | 252.26 | -8 462.43% |
| 31.01.2018 | 155.96 | 119.25 | 36.71 | 30.78% | -72.60 | 228.56 | - 314.83% |
| 31.12.2017 | 119.25 | 107.13 | 12.12 | 11.32% | 252.42 | - 133.17 | -52.76% |
| 30.11.2017 | 107.13 | -3.42 | 110.55 | -3 229.65% | 207.56 | - 100.44 | -48.39% |
| 31.10.2017 | -3.42 | 285.43 | - 288.86 | - 101.20% | 58.52 | -61.94 | - 105.85% |
| 30.09.2017 | 285.43 | 179.25 | 106.18 | 59.24% | 348.36 | -62.92 | -18.06% |
| 31.08.2017 | 179.25 | 269.06 | -89.80 | -33.38% | 60.65 | 118.61 | 195.57% |
| 31.07.2017 | 269.06 | 1 037.43 | - 768.37 | -74.07% | - 278.17 | 547.23 | - 196.72% |
| 30.06.2017 | 1 037.43 | 158.44 | 878.98 | 554.76% | 823.08 | 214.35 | 26.04% |
| 31.05.2017 | 158.44 | -1.99 | 160.44 | -8 062.06% | 118.55 | 39.90 | 33.66% |
| 30.04.2017 | -1.99 | 515.53 | - 517.52 | - 100.39% | 79.78 | -81.77 | - 102.49% |
| 31.03.2017 | 515.53 | -2.98 | 518.51 | -17 393.83% | 626.60 | - 111.08 | -17.73% |
| 28.02.2017 | -2.98 | -72.60 | 69.61 | -95.89% | 285.00 | - 287.98 | - 101.05% |
| 31.01.2017 | -72.60 | 252.42 | - 325.02 | - 128.76% | 233.37 | - 305.96 | - 131.11% |
| 31.12.2016 | 252.42 | 207.56 | 44.85 | 21.61% | 290.98 | -38.56 | -13.25% |
| 30.11.2016 | 207.56 | 58.52 | 149.05 | 254.70% | 31.20 | 176.37 | 565.32% |
| 31.10.2016 | 58.52 | 348.36 | - 289.84 | -83.20% | 349.99 | - 291.48 | -83.28% |
| 30.09.2016 | 348.36 | 60.65 | 287.71 | 474.41% | 81.32 | 267.03 | 328.37% |
| 31.08.2016 | 60.65 | - 278.17 | 338.82 | - 121.80% | 62.25 | -1.60 | -2.58% |
| 31.07.2016 | - 278.17 | 823.08 | -1 101.25 | - 133.80% | 48.96 | - 327.13 | - 668.20% |
| 30.06.2016 | 823.08 | 118.55 | 704.53 | 594.30% | 460.29 | 362.79 | 78.82% |
| 31.05.2016 | 118.55 | 79.78 | 38.76 | 48.58% | -47.59 | 166.13 | - 349.11% |
| 30.04.2016 | 79.78 | 626.60 | - 546.82 | -87.27% | - 169.85 | 249.64 | - 146.97% |
| 31.03.2016 | 626.60 | 285.00 | 341.60 | 119.86% | 18.75 | 607.86 | 3 242.42% |
| 29.02.2016 | 285.00 | 233.37 | 51.63 | 22.13% | 83.29 | 201.71 | 242.18% |
| 31.01.2016 | 233.37 | 290.98 | -57.61 | -19.80% | 409.08 | - 175.71 | -42.95% |
| 31.12.2015 | 290.98 | 31.20 | 259.78 | 832.68% | - 394.89 | 685.87 | - 173.68% |
| 30.11.2015 | 31.20 | 349.99 | - 318.80 | -91.09% | 142.03 | - 110.83 | -78.03% |
| 31.10.2015 | 349.99 | 81.32 | 268.67 | 330.38% | 31.63 | 318.37 | 1 006.56% |
| 30.09.2015 | 81.32 | 62.25 | 19.07 | 30.64% | -68.11 | 149.43 | - 219.40% |
| 31.08.2015 | 62.25 | 48.96 | 13.29 | 27.15% | 54.44 | 7.81 | 14.35% |
| 31.07.2015 | 48.96 | 460.29 | - 411.33 | -89.36% | -80.38 | 129.34 | - 160.91% |
| 30.06.2015 | 460.29 | -47.59 | 507.88 | -1 067.24% | 154.52 | 305.77 | 197.88% |
| 31.05.2015 | -47.59 | - 169.85 | 122.27 | -71.98% | 610.72 | - 658.31 | - 107.79% |
| 30.04.2015 | - 169.85 | 18.75 | - 188.60 | -1 006.03% | 14.15 | - 184.00 | -1 300.30% |
| 31.03.2015 | 18.75 | 83.29 | -64.54 | -77.49% | - 294.19 | 312.94 | - 106.37% |
| 28.02.2015 | 83.29 | 409.08 | - 325.79 | -79.64% | 28.04 | 55.25 | 197.03% |
| 31.01.2015 | 409.08 | - 394.89 | 803.98 | - 203.59% | 203.32 | 205.76 | 101.20% |
| 31.12.2014 | - 394.89 | 142.03 | - 536.92 | - 378.04% | 269.56 | - 664.46 | - 246.49% |
| 30.11.2014 | 142.03 | 31.63 | 110.40 | 349.04% | - 183.54 | 325.57 | - 177.38% |
| 31.10.2014 | 31.63 | -68.11 | 99.74 | - 146.44% | -10.27 | 41.90 | - 408.09% |
| 30.09.2014 | -68.11 | 54.44 | - 122.55 | - 225.12% | 152.64 | - 220.75 | - 144.62% |
| 31.08.2014 | 54.44 | -80.38 | 134.82 | - 167.73% | - 156.33 | 210.76 | - 134.82% |
| 31.07.2014 | -80.38 | 154.52 | - 234.90 | - 152.02% | 56.79 | - 137.17 | - 241.55% |
| 30.06.2014 | 154.52 | 610.72 | - 456.20 | -74.70% | 41.37 | 113.15 | 273.49% |
| 31.05.2014 | 610.72 | 14.15 | 596.57 | 4 215.73% | - 128.90 | 739.61 | - 573.81% |
| 30.04.2014 | 14.15 | - 294.19 | 308.35 | - 104.81% | -9.61 | 23.76 | - 247.22% |
| 31.03.2014 | - 294.19 | 28.04 | - 322.24 | -1 149.16% | - 115.64 | - 178.56 | 154.41% |
| 28.02.2014 | 28.04 | 203.32 | - 175.28 | -86.21% | -73.59 | 101.63 | - 138.10% |
| 31.01.2014 | 203.32 | 269.56 | -66.25 | -24.57% | 26.49 | 176.83 | 667.56% |
| 31.12.2013 | 269.56 | - 183.54 | 453.10 | - 246.87% | 211.67 | 57.89 | 27.35% |
| 30.11.2013 | - 183.54 | -10.27 | - 173.27 | 1 687.84% | -61.12 | - 122.42 | 200.29% |
| 31.10.2013 | -10.27 | 152.64 | - 162.90 | - 106.73% | 135.02 | - 145.28 | - 107.60% |
| 30.09.2013 | 152.64 | - 156.33 | 308.96 | - 197.64% | -8.24 | 160.88 | -1 951.26% |
| 31.08.2013 | - 156.33 | 56.79 | - 213.11 | - 375.29% | - 125.87 | -30.46 | 24.20% |
| 31.07.2013 | 56.79 | 41.37 | 15.41 | 37.26% | -98.81 | 155.60 | - 157.47% |
| 30.06.2013 | 41.37 | - 128.90 | 170.27 | - 132.10% | - 705.76 | 747.13 | - 105.86% |
| 31.05.2013 | - 128.90 | -9.61 | - 119.28 | 1 240.98% | - 148.96 | 20.07 | -13.47% |
| 30.04.2013 | -9.61 | - 115.64 | 106.03 | -91.69% | 103.84 | - 113.46 | - 109.26% |
| 31.03.2013 | - 115.64 | -73.59 | -42.05 | 57.13% | 221.22 | - 336.86 | - 152.27% |
| 28.02.2013 | -73.59 | 26.49 | - 100.08 | - 377.82% | 130.64 | - 204.24 | - 156.33% |
| 31.01.2013 | 26.49 | 211.67 | - 185.18 | -87.49% | 346.42 | - 319.93 | -92.35% |
| 31.12.2012 | 211.67 | -61.12 | 272.79 | - 446.32% | - 128.44 | 340.12 | - 264.80% |
| 30.11.2012 | -61.12 | 135.02 | - 196.14 | - 145.27% | - 222.31 | 161.19 | -72.51% |
| 31.10.2012 | 135.02 | -8.24 | 143.26 | -1 737.59% | 162.33 | -27.31 | -16.82% |
| 30.09.2012 | -8.24 | - 125.87 | 117.62 | -93.45% | - 395.61 | 387.36 | -97.92% |
| 31.08.2012 | - 125.87 | -98.81 | -27.05 | 27.38% | - 363.39 | 237.52 | -65.36% |
| 31.07.2012 | -98.81 | - 705.76 | 606.95 | -86.00% | 91.64 | - 190.46 | - 207.83% |
| 30.06.2012 | - 705.76 | - 148.96 | - 556.80 | 373.78% | 70.04 | - 775.80 | -1 107.67% |
| 31.05.2012 | - 148.96 | 103.84 | - 252.81 | - 243.45% | -89.65 | -59.31 | 66.16% |
| 30.04.2012 | 103.84 | 221.22 | - 117.37 | -53.06% | -12.08 | 115.93 | - 959.42% |
| 31.03.2012 | 221.22 | 130.64 | 90.57 | 69.33% | 14.33 | 206.88 | 1 443.41% |
| 29.02.2012 | 130.64 | 346.42 | - 215.78 | -62.29% | 0.10 | 130.54 | 130 543.00% |
| 31.01.2012 | 346.42 | - 128.44 | 474.87 | - 369.70% | -17.05 | 363.47 | -2 131.55% |
| 31.12.2011 | - 128.44 | - 222.31 | 93.87 | -42.22% | -90.68 | -37.76 | 41.64% |
| 30.11.2011 | - 222.31 | 162.33 | - 384.64 | - 236.95% | 163.06 | - 385.38 | - 236.34% |
| 31.10.2011 | 162.33 | - 395.61 | 557.93 | - 141.03% | 304.58 | - 142.25 | -46.70% |
| 30.09.2011 | - 395.61 | - 363.39 | -32.22 | 8.87% | 177.39 | - 573.00 | - 323.01% |
| 31.08.2011 | - 363.39 | 91.64 | - 455.03 | - 496.53% | 234.81 | - 598.19 | - 254.76% |
| 31.07.2011 | 91.64 | 70.04 | 21.60 | 30.84% | - 367.67 | 459.31 | - 124.93% |
| 30.06.2011 | 70.04 | -89.65 | 159.69 | - 178.12% | 187.24 | - 117.20 | -62.59% |
| 31.05.2011 | -89.65 | -12.08 | -77.57 | 641.97% | 904.14 | - 993.79 | - 109.92% |
| 30.04.2011 | -12.08 | 14.33 | -26.42 | - 184.30% | 121.99 | - 134.08 | - 109.90% |
| 31.03.2011 | 14.33 | 0.10 | 14.23 | 14 233.00% | 595.79 | - 581.46 | -97.59% |
| 28.02.2011 | 0.10 | -17.05 | 17.15 | - 100.59% | 67.33 | -67.23 | -99.85% |
| 31.01.2011 | -17.05 | -90.68 | 73.63 | -81.20% | - 214.11 | 197.06 | -92.04% |
| 31.12.2010 | -90.68 | 163.06 | - 253.75 | - 155.61% | -22.60 | -68.08 | 301.27% |
| 30.11.2010 | 163.06 | 304.58 | - 141.52 | -46.46% | 228.47 | -65.41 | -28.63% |
| 31.10.2010 | 304.58 | 177.39 | 127.19 | 71.70% | 288.89 | 15.69 | 5.43% |
| 30.09.2010 | 177.39 | 234.81 | -57.41 | -24.45% | 66.53 | 110.86 | 166.62% |
| 31.08.2010 | 234.81 | - 367.67 | 602.47 | - 163.86% | 38.15 | 196.65 | 515.45% |
| 31.07.2010 | - 367.67 | 187.24 | - 554.91 | - 296.36% | -19.23 | - 348.43 | 1 811.84% |
| 30.06.2010 | 187.24 | 904.14 | - 716.90 | -79.29% | 159.56 | 27.68 | 17.35% |
| 31.05.2010 | 904.14 | 121.99 | 782.15 | 641.14% | - 148.30 | 1 052.44 | - 709.67% |
| 30.04.2010 | 121.99 | 595.79 | - 473.80 | -79.52% | 105.07 | 16.93 | 16.11% |
| 31.03.2010 | 595.79 | 67.33 | 528.46 | 784.89% | - 184.40 | 780.19 | - 423.09% |
| 28.02.2010 | 67.33 | - 214.11 | 281.44 | - 131.45% | -6.55 | 73.88 | -1 127.14% |
| 31.01.2010 | - 214.11 | -22.60 | - 191.51 | 847.44% | 132.95 | - 347.06 | - 261.05% |
| 31.12.2009 | -22.60 | 228.47 | - 251.07 | - 109.89% | - | - | - |
| 30.11.2009 | 228.47 | 288.89 | -60.42 | -20.91% | - | - | - |
| 31.10.2009 | 288.89 | 66.53 | 222.36 | 334.21% | - | - | - |
| 30.09.2009 | 66.53 | 38.15 | 28.38 | 74.39% | - | - | - |
| 31.08.2009 | 38.15 | -19.23 | 57.38 | - 298.39% | - | - | - |
| 31.07.2009 | -19.23 | 159.56 | - 178.79 | - 112.05% | - | - | - |
| 30.06.2009 | 159.56 | - 148.30 | 307.86 | - 207.60% | - | - | - |
| 31.05.2009 | - 148.30 | 105.07 | - 253.37 | - 241.15% | - | - | - |
| 30.04.2009 | 105.07 | - 184.40 | 289.47 | - 156.98% | - | - | - |
| 31.03.2009 | - 184.40 | -6.55 | - 177.85 | 2 713.18% | - | - | - |
| 28.02.2009 | -6.55 | 132.95 | - 139.50 | - 104.93% | - | - | - |
| 31.01.2009 | 132.95 | - | - | - | - | - | - |
Graf jako obrázek

Podobné sestavy
Aplikace Ekonomika ČNB ze sekce makroekonomika zobrazuje časové řady hlavních makroekonomických údajů z ekonomiky ČR. Najdete zde přes 10.000 grafů různých hodnot od úrokových sazeb, přes statistiky státního rozpočtu, statistiky ČNB a data zpracovávaná ČSÚ. Data jsou k dispozici obvykle za posledních více než 20 let, od prosince roku 1992. Zdroj dat: ČNB ARAD

