Mutual funds shares/units issued (Other Funds Balance Sheet - Flows) - ekonomika ČNB
Aktualizace dat Mutual funds shares/units issued (Other Funds Balance Sheet - Flows) v této aplikaci skončila 30.6.2023. Aktualizovná data časových řad najdete na stránkách nové aplikace z dat ARAD ČNB
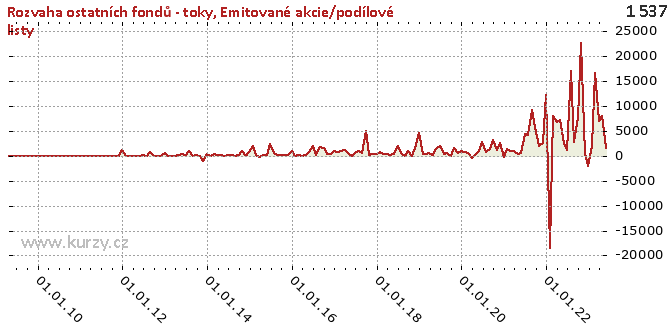
Graf hodnot, Other Funds Balance Sheet - Flows
Meziroční srovnání
Minima a maxima
| Typ | Období | Hodnota |
|---|---|---|
| Max | 30.09.2017 | 4 970.55 |
| Min | 30.11.2013 | -1 092.69 |
Historické hodnoty
| Období | Hodnota | Předchozí | Rozdíl | Změna | Před rokem | Rozdíl | Změna |
|---|---|---|---|---|---|---|---|
| 30.06.2020 | 2 604.16 | 169.78 | 2 434.38 | 1 433.85% | 1 961.53 | 642.63 | 32.76% |
| 31.05.2020 | 169.78 | - 389.22 | 559.00 | - 143.62% | 1 354.50 | -1 184.72 | -87.47% |
| 30.04.2020 | - 389.22 | 770.85 | -1 160.07 | - 150.49% | 256.16 | - 645.38 | - 251.95% |
| 31.03.2020 | 770.85 | 870.94 | - 100.08 | -11.49% | 555.12 | 215.73 | 38.86% |
| 29.02.2020 | 870.94 | 493.18 | 377.76 | 76.60% | 342.70 | 528.23 | 154.14% |
| 31.01.2020 | 493.18 | 2 020.13 | -1 526.95 | -75.59% | 441.69 | 51.49 | 11.66% |
| 31.12.2019 | 2 020.13 | 584.69 | 1 435.44 | 245.50% | 4 553.74 | -2 533.61 | -55.64% |
| 30.11.2019 | 584.69 | 1 578.72 | - 994.03 | -62.96% | 1 559.76 | - 975.07 | -62.51% |
| 31.10.2019 | 1 578.72 | 61.59 | 1 517.13 | 2 463.28% | -21.42 | 1 600.14 | -7 471.70% |
| 30.09.2019 | 61.59 | 511.58 | - 449.99 | -87.96% | 1 014.46 | - 952.87 | -93.93% |
| 31.08.2019 | 511.58 | 410.70 | 100.88 | 24.56% | 52.41 | 459.17 | 876.13% |
| 31.07.2019 | 410.70 | 1 961.53 | -1 550.83 | -79.06% | 507.30 | -96.60 | -19.04% |
| 30.06.2019 | 1 961.53 | 1 354.50 | 607.03 | 44.82% | 2 040.19 | -78.66 | -3.86% |
| 31.05.2019 | 1 354.50 | 256.16 | 1 098.34 | 428.78% | 364.36 | 990.14 | 271.75% |
| 30.04.2019 | 256.16 | 555.12 | - 298.96 | -53.86% | 259.92 | -3.76 | -1.45% |
| 31.03.2019 | 555.12 | 342.70 | 212.42 | 61.98% | 469.05 | 86.08 | 18.35% |
| 28.02.2019 | 342.70 | 441.69 | -98.98 | -22.41% | 319.75 | 22.95 | 7.18% |
| 31.01.2019 | 441.69 | 4 553.74 | -4 112.06 | -90.30% | 828.72 | - 387.03 | -46.70% |
| 31.12.2018 | 4 553.74 | 1 559.76 | 2 993.98 | 191.95% | 324.54 | 4 229.20 | 1 303.12% |
| 30.11.2018 | 1 559.76 | -21.42 | 1 581.18 | -7 383.16% | 365.30 | 1 194.46 | 326.98% |
| 31.10.2018 | -21.42 | 1 014.46 | -1 035.88 | - 102.11% | 182.74 | - 204.15 | - 111.72% |
| 30.09.2018 | 1 014.46 | 52.41 | 962.05 | 1 835.67% | 4 970.55 | -3 956.09 | -79.59% |
| 31.08.2018 | 52.41 | 507.30 | - 454.89 | -89.67% | 616.68 | - 564.27 | -91.50% |
| 31.07.2018 | 507.30 | 2 040.19 | -1 532.89 | -75.13% | 906.61 | - 399.31 | -44.04% |
| 30.06.2018 | 2 040.19 | 364.36 | 1 675.83 | 459.94% | 593.18 | 1 447.01 | 243.94% |
| 31.05.2018 | 364.36 | 259.92 | 104.44 | 40.18% | -70.56 | 434.92 | - 616.41% |
| 30.04.2018 | 259.92 | 469.05 | - 209.13 | -44.59% | 484.72 | - 224.81 | -46.38% |
| 31.03.2018 | 469.05 | 319.75 | 149.29 | 46.69% | 1 144.24 | - 675.20 | -59.01% |
| 28.02.2018 | 319.75 | 828.72 | - 508.96 | -61.42% | 958.72 | - 638.96 | -66.65% |
| 31.01.2018 | 828.72 | 324.54 | 504.17 | 155.35% | 689.32 | 139.39 | 20.22% |
| 31.12.2017 | 324.54 | 365.30 | -40.75 | -11.16% | 892.27 | - 567.72 | -63.63% |
| 30.11.2017 | 365.30 | 182.74 | 182.56 | 99.90% | 352.14 | 13.15 | 3.74% |
| 31.10.2017 | 182.74 | 4 970.55 | -4 787.81 | -96.32% | 459.83 | - 277.09 | -60.26% |
| 30.09.2017 | 4 970.55 | 616.68 | 4 353.87 | 706.02% | 1 580.15 | 3 390.40 | 214.56% |
| 31.08.2017 | 616.68 | 906.61 | - 289.93 | -31.98% | 1 803.88 | -1 187.20 | -65.81% |
| 31.07.2017 | 906.61 | 593.18 | 313.43 | 52.84% | 250.30 | 656.31 | 262.21% |
| 30.06.2017 | 593.18 | -70.56 | 663.73 | - 940.72% | 2 020.86 | -1 427.68 | -70.65% |
| 31.05.2017 | -70.56 | 484.72 | - 555.28 | - 114.56% | 787.82 | - 858.37 | - 108.96% |
| 30.04.2017 | 484.72 | 1 144.24 | - 659.52 | -57.64% | 185.45 | 299.27 | 161.38% |
| 31.03.2017 | 1 144.24 | 958.72 | 185.53 | 19.35% | 59.16 | 1 085.08 | 1 834.02% |
| 28.02.2017 | 958.72 | 689.32 | 269.39 | 39.08% | 118.61 | 840.10 | 708.28% |
| 31.01.2017 | 689.32 | 892.27 | - 202.94 | -22.74% | 56.90 | 632.42 | 1 111.44% |
| 31.12.2016 | 892.27 | 352.14 | 540.12 | 153.38% | 1 059.24 | - 166.97 | -15.76% |
| 30.11.2016 | 352.14 | 459.83 | - 107.68 | -23.42% | 150.11 | 202.04 | 134.59% |
| 31.10.2016 | 459.83 | 1 580.15 | -1 120.32 | -70.90% | 152.56 | 307.26 | 201.40% |
| 30.09.2016 | 1 580.15 | 1 803.88 | - 223.72 | -12.40% | 230.86 | 1 349.29 | 584.46% |
| 31.08.2016 | 1 803.88 | 250.30 | 1 553.58 | 620.69% | 166.37 | 1 637.51 | 984.25% |
| 31.07.2016 | 250.30 | 2 020.86 | -1 770.56 | -87.61% | 533.92 | - 283.62 | -53.12% |
| 30.06.2016 | 2 020.86 | 787.82 | 1 233.05 | 156.51% | 2 411.66 | - 390.80 | -16.20% |
| 31.05.2016 | 787.82 | 185.45 | 602.37 | 324.82% | 109.20 | 678.61 | 621.41% |
| 30.04.2016 | 185.45 | 59.16 | 126.28 | 213.45% | 132.72 | 52.72 | 39.72% |
| 31.03.2016 | 59.16 | 118.61 | -59.45 | -50.12% | - 175.81 | 234.98 | - 133.65% |
| 29.02.2016 | 118.61 | 56.90 | 61.71 | 108.45% | 249.79 | - 131.18 | -52.52% |
| 31.01.2016 | 56.90 | 1 059.24 | -1 002.34 | -94.63% | 2 039.43 | -1 982.53 | -97.21% |
| 31.12.2015 | 1 059.24 | 150.11 | 909.13 | 605.65% | 674.37 | 384.88 | 57.07% |
| 30.11.2015 | 150.11 | 152.56 | -2.46 | -1.61% | 64.51 | 85.59 | 132.68% |
| 31.10.2015 | 152.56 | 230.86 | -78.30 | -33.91% | 879.01 | - 726.45 | -82.64% |
| 30.09.2015 | 230.86 | 166.37 | 64.49 | 38.76% | 201.50 | 29.36 | 14.57% |
| 31.08.2015 | 166.37 | 533.92 | - 367.55 | -68.84% | 12.33 | 154.04 | 1 248.87% |
| 31.07.2015 | 533.92 | 2 411.66 | -1 877.74 | -77.86% | 158.41 | 375.51 | 237.06% |
| 30.06.2015 | 2 411.66 | 109.20 | 2 302.46 | 2 108.38% | 165.35 | 2 246.31 | 1 358.52% |
| 31.05.2015 | 109.20 | 132.72 | -23.52 | -17.72% | 46.42 | 62.79 | 135.27% |
| 30.04.2015 | 132.72 | - 175.81 | 308.54 | - 175.49% | 123.37 | 9.36 | 7.58% |
| 31.03.2015 | - 175.81 | 249.79 | - 425.60 | - 170.38% | 104.31 | - 280.13 | - 268.54% |
| 28.02.2015 | 249.79 | 2 039.43 | -1 789.64 | -87.75% | 472.59 | - 222.80 | -47.14% |
| 31.01.2015 | 2 039.43 | 674.37 | 1 365.06 | 202.42% | -1.21 | 2 040.63 | - 169 346.97% |
| 31.12.2014 | 674.37 | 64.51 | 609.85 | 945.32% | 418.68 | 255.69 | 61.07% |
| 30.11.2014 | 64.51 | 879.01 | - 814.50 | -92.66% | -1 092.69 | 1 157.21 | - 105.90% |
| 31.10.2014 | 879.01 | 201.50 | 677.52 | 336.24% | -4.08 | 883.09 | -21 665.60% |
| 30.09.2014 | 201.50 | 12.33 | 189.16 | 1 533.67% | 259.96 | -58.46 | -22.49% |
| 31.08.2014 | 12.33 | 158.41 | - 146.07 | -92.21% | 11.56 | 0.78 | 6.73% |
| 31.07.2014 | 158.41 | 165.35 | -6.95 | -4.20% | 888.47 | - 730.06 | -82.17% |
| 30.06.2014 | 165.35 | 46.42 | 118.93 | 256.23% | 113.59 | 51.76 | 45.56% |
| 31.05.2014 | 46.42 | 123.37 | -76.95 | -62.38% | 373.06 | - 326.65 | -87.56% |
| 30.04.2014 | 123.37 | 104.31 | 19.05 | 18.27% | 124.06 | -0.69 | -0.55% |
| 31.03.2014 | 104.31 | 472.59 | - 368.27 | -77.93% | 16.84 | 87.48 | 519.55% |
| 28.02.2014 | 472.59 | -1.21 | 473.79 | -39 318.76% | -2.06 | 474.64 | -23 074.53% |
| 31.01.2014 | -1.21 | 418.68 | - 419.88 | - 100.29% | 56.47 | -57.67 | - 102.13% |
| 31.12.2013 | 418.68 | -1 092.69 | 1 511.37 | - 138.32% | 589.87 | - 171.19 | -29.02% |
| 30.11.2013 | -1 092.69 | -4.08 | -1 088.62 | 26 708.00% | 14.96 | -1 107.65 | -7 405.57% |
| 31.10.2013 | -4.08 | 259.96 | - 264.03 | - 101.57% | 28.05 | -32.12 | - 114.53% |
| 30.09.2013 | 259.96 | 11.56 | 248.40 | 2 149.54% | 17.20 | 242.76 | 1 411.38% |
| 31.08.2013 | 11.56 | 888.47 | - 876.91 | -98.70% | 750.79 | - 739.24 | -98.46% |
| 31.07.2013 | 888.47 | 113.59 | 774.88 | 682.15% | -4.16 | 892.62 | -21 477.96% |
| 30.06.2013 | 113.59 | 373.06 | - 259.47 | -69.55% | 118.95 | -5.36 | -4.51% |
| 31.05.2013 | 373.06 | 124.06 | 249.01 | 200.72% | 39.59 | 333.47 | 842.29% |
| 30.04.2013 | 124.06 | 16.84 | 107.22 | 636.81% | 21.24 | 102.82 | 484.18% |
| 31.03.2013 | 16.84 | -2.06 | 18.89 | - 918.52% | 38.93 | -22.10 | -56.75% |
| 28.02.2013 | -2.06 | 56.47 | -58.53 | - 103.64% | -0.46 | -1.60 | 346.20% |
| 31.01.2013 | 56.47 | 589.87 | - 533.40 | -90.43% | 22.29 | 34.18 | 153.33% |
| 31.12.2012 | 589.87 | 14.96 | 574.91 | 3 843.77% | 1 186.92 | - 597.05 | -50.30% |
| 30.11.2012 | 14.96 | 28.05 | -13.09 | -46.67% | 15.46 | -0.51 | -3.28% |
| 31.10.2012 | 28.05 | 17.20 | 10.85 | 63.07% | 30.85 | -2.80 | -9.07% |
| 30.09.2012 | 17.20 | 750.79 | - 733.59 | -97.71% | 56.17 | -38.97 | -69.38% |
| 31.08.2012 | 750.79 | -4.16 | 754.95 | -18 165.26% | 32.46 | 718.33 | 2 212.90% |
| 31.07.2012 | -4.16 | 118.95 | - 123.11 | - 103.49% | 2.87 | -7.02 | - 244.91% |
| 30.06.2012 | 118.95 | 39.59 | 79.36 | 200.45% | 57.21 | 61.74 | 107.91% |
| 31.05.2012 | 39.59 | 21.24 | 18.36 | 86.43% | 14.96 | 24.63 | 164.66% |
| 30.04.2012 | 21.24 | 38.93 | -17.70 | -45.45% | 1.94 | 19.29 | 993.51% |
| 31.03.2012 | 38.93 | -0.46 | 39.39 | -8 545.34% | 15.88 | 23.06 | 145.25% |
| 29.02.2012 | -0.46 | 22.29 | -22.75 | - 102.07% | 0.00 | -0.46 | - |
| 31.01.2012 | 22.29 | 1 186.92 | -1 164.62 | -98.12% | 0.00 | 22.29 | - |
| 31.12.2011 | 1 186.92 | 15.46 | 1 171.45 | 7 575.35% | 0.00 | 1 186.92 | - |
| 30.11.2011 | 15.46 | 30.85 | -15.38 | -49.87% | -1.00 | 16.46 | -1 644.86% |
| 31.10.2011 | 30.85 | 56.17 | -25.33 | -45.09% | 0.27 | 30.58 | 11 540.38% |
| 30.09.2011 | 56.17 | 32.46 | 23.71 | 73.05% | 0.18 | 55.99 | 30 429.35% |
| 31.08.2011 | 32.46 | 2.87 | 29.59 | 1 031.83% | -0.20 | 32.66 | -16 494.44% |
| 31.07.2011 | 2.87 | 57.21 | -54.35 | -94.99% | 0.77 | 2.10 | 272.95% |
| 30.06.2011 | 57.21 | 14.96 | 42.26 | 282.47% | -0.12 | 57.34 | -46 240.32% |
| 31.05.2011 | 14.96 | 1.94 | 13.02 | 670.29% | -0.13 | 15.09 | -11 432.58% |
| 30.04.2011 | 1.94 | 15.88 | -13.93 | -87.77% | -0.04 | 1.98 | -5 079.49% |
| 31.03.2011 | 15.88 | 0.00 | 15.88 | - | -0.15 | 16.03 | -10 613.25% |
| 28.02.2011 | 0.00 | 0.00 | 0.00 | - | -0.13 | 0.13 | - |
| 31.01.2011 | 0.00 | 0.00 | 0.00 | - | -0.10 | 0.10 | - |
| 31.12.2010 | 0.00 | -1.00 | 1.00 | - | -0.13 | 0.13 | - |
| 30.11.2010 | -1.00 | 0.27 | -1.27 | - 477.74% | -0.13 | -0.87 | 682.03% |
| 31.10.2010 | 0.27 | 0.18 | 0.08 | 44.02% | 0.87 | -0.61 | -69.61% |
| 30.09.2010 | 0.18 | -0.20 | 0.38 | - 192.93% | -0.13 | 0.31 | - 246.03% |
| 31.08.2010 | -0.20 | 0.77 | -0.97 | - 125.75% | -0.17 | -0.03 | 18.56% |
| 31.07.2010 | 0.77 | -0.12 | 0.89 | - 720.16% | -0.23 | 1.00 | - 435.81% |
| 30.06.2010 | -0.12 | -0.13 | 0.01 | -6.06% | -0.10 | -0.03 | 25.25% |
| 31.05.2010 | -0.13 | -0.04 | -0.09 | 238.46% | -0.18 | 0.05 | -28.65% |
| 30.04.2010 | -0.04 | -0.15 | 0.11 | -74.17% | 50.99 | -51.03 | - 100.08% |
| 31.03.2010 | -0.15 | -0.13 | -0.02 | 17.97% | - | - | - |
| 28.02.2010 | -0.13 | -0.10 | -0.02 | 23.08% | - | - | - |
| 31.01.2010 | -0.10 | -0.13 | 0.02 | -18.75% | - | - | - |
| 31.12.2009 | -0.13 | -0.13 | 0.00 | 0.00 | - | - | - |
| 30.11.2009 | -0.13 | 0.87 | -1.00 | - 114.68% | - | - | - |
| 31.10.2009 | 0.87 | -0.13 | 1.00 | - 792.06% | - | - | - |
| 30.09.2009 | -0.13 | -0.17 | 0.04 | -24.55% | - | - | - |
| 31.08.2009 | -0.17 | -0.23 | 0.06 | -27.07% | - | - | - |
| 31.07.2009 | -0.23 | -0.10 | -0.13 | 131.31% | - | - | - |
| 30.06.2009 | -0.10 | -0.18 | 0.09 | -46.49% | - | - | - |
| 31.05.2009 | -0.18 | 50.99 | -51.17 | - 100.36% | - | - | - |
| 30.04.2009 | 50.99 | - | - | - | - | - | - |
Graf jako obrázek

Podobné sestavy
Aplikace Ekonomika ČNB ze sekce makroekonomika zobrazuje časové řady hlavních makroekonomických údajů z ekonomiky ČR. Najdete zde přes 10.000 grafů různých hodnot od úrokových sazeb, přes statistiky státního rozpočtu, statistiky ČNB a data zpracovávaná ČSÚ. Data jsou k dispozici obvykle za posledních více než 20 let, od prosince roku 1992. Zdroj dat: ČNB ARAD

