Investment fund shares/units (Real estate funds balance sheet) - ekonomika ČNB
Aktualizace dat Investment fund shares/units (Real estate funds balance sheet) v této aplikaci skončila 30.6.2023. Aktualizovná data časových řad najdete na stránkách nové aplikace z dat ARAD ČNB
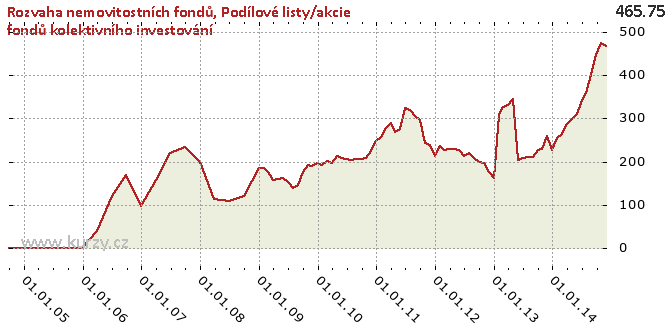
Graf hodnot, Real estate funds balance sheet
Meziroční srovnání
Minima a maxima
| Typ | Období | Hodnota |
|---|---|---|
| Max | 31.10.2014 | 474.69 |
| Min | 31.03.2006 | 41.14 |
Historické hodnoty
| Období | Hodnota | Předchozí | Rozdíl | Změna | Před rokem | Rozdíl | Změna |
|---|---|---|---|---|---|---|---|
| 30.11.2014 | 465.76 | 474.69 | -8.93 | -1.88% | 260.01 | 205.74 | 79.13% |
| 31.10.2014 | 474.69 | 444.94 | 29.75 | 6.69% | 228.82 | 245.88 | 107.46% |
| 30.09.2014 | 444.94 | 400.21 | 44.73 | 11.18% | 226.61 | 218.34 | 96.35% |
| 31.08.2014 | 400.21 | 358.11 | 42.10 | 11.76% | 211.70 | 188.51 | 89.04% |
| 31.07.2014 | 358.11 | 334.47 | 23.64 | 7.07% | 209.71 | 148.40 | 70.77% |
| 30.06.2014 | 334.47 | 311.01 | 23.46 | 7.54% | 209.27 | 125.19 | 59.82% |
| 31.05.2014 | 311.01 | 297.55 | 13.46 | 4.52% | 204.63 | 106.37 | 51.98% |
| 30.04.2014 | 297.55 | 286.42 | 11.13 | 3.89% | 344.73 | -47.19 | -13.69% |
| 31.03.2014 | 286.42 | 263.92 | 22.50 | 8.52% | 331.61 | -45.19 | -13.63% |
| 28.02.2014 | 263.92 | 254.34 | 9.58 | 3.77% | 326.44 | -62.51 | -19.15% |
| 31.01.2014 | 254.34 | 226.54 | 27.81 | 12.27% | 308.13 | -53.79 | -17.46% |
| 31.12.2013 | 226.54 | 260.01 | -33.48 | -12.88% | 163.16 | 63.38 | 38.85% |
| 30.11.2013 | 260.01 | 228.82 | 31.20 | 13.63% | 176.68 | 83.34 | 47.17% |
| 31.10.2013 | 228.82 | 226.61 | 2.21 | 0.97% | 198.03 | 30.79 | 15.55% |
| 30.09.2013 | 226.61 | 211.70 | 14.91 | 7.04% | 199.96 | 26.65 | 13.33% |
| 31.08.2013 | 211.70 | 209.71 | 2.00 | 0.95% | 208.44 | 3.26 | 1.56% |
| 31.07.2013 | 209.71 | 209.27 | 0.43 | 0.21% | 219.36 | -9.65 | -4.40% |
| 30.06.2013 | 209.27 | 204.63 | 4.64 | 2.27% | 214.21 | -4.94 | -2.31% |
| 31.05.2013 | 204.63 | 344.73 | - 140.10 | -40.64% | 226.13 | -21.50 | -9.51% |
| 30.04.2013 | 344.73 | 331.61 | 13.12 | 3.96% | 229.26 | 115.47 | 50.37% |
| 31.03.2013 | 331.61 | 326.44 | 5.17 | 1.58% | 229.49 | 102.12 | 44.50% |
| 28.02.2013 | 326.44 | 308.13 | 18.30 | 5.94% | 227.88 | 98.56 | 43.25% |
| 31.01.2013 | 308.13 | 163.16 | 144.98 | 88.86% | 236.45 | 71.68 | 30.31% |
| 31.12.2012 | 163.16 | 176.68 | -13.52 | -7.65% | 212.70 | -49.54 | -23.29% |
| 30.11.2012 | 176.68 | 198.03 | -21.35 | -10.78% | 239.56 | -62.89 | -26.25% |
| 31.10.2012 | 198.03 | 199.96 | -1.93 | -0.97% | 242.76 | -44.74 | -18.43% |
| 30.09.2012 | 199.96 | 208.44 | -8.49 | -4.07% | 296.67 | -96.71 | -32.60% |
| 31.08.2012 | 208.44 | 219.36 | -10.92 | -4.98% | 305.30 | -96.86 | -31.73% |
| 31.07.2012 | 219.36 | 214.21 | 5.15 | 2.40% | 319.78 | - 100.42 | -31.40% |
| 30.06.2012 | 214.21 | 226.13 | -11.91 | -5.27% | 324.74 | - 110.53 | -34.04% |
| 31.05.2012 | 226.13 | 229.26 | -3.13 | -1.37% | 275.54 | -49.41 | -17.93% |
| 30.04.2012 | 229.26 | 229.49 | -0.23 | -0.10% | 268.30 | -39.04 | -14.55% |
| 31.03.2012 | 229.49 | 227.88 | 1.62 | 0.71% | 289.73 | -60.24 | -20.79% |
| 29.02.2012 | 227.88 | 236.45 | -8.58 | -3.63% | 278.75 | -50.87 | -18.25% |
| 31.01.2012 | 236.45 | 212.70 | 23.75 | 11.17% | 256.09 | -19.64 | -7.67% |
| 31.12.2011 | 212.70 | 239.56 | -26.87 | -11.21% | 248.83 | -36.13 | -14.52% |
| 30.11.2011 | 239.56 | 242.76 | -3.20 | -1.32% | 223.92 | 15.65 | 6.99% |
| 31.10.2011 | 242.76 | 296.67 | -53.90 | -18.17% | 209.16 | 33.61 | 16.07% |
| 30.09.2011 | 296.67 | 305.30 | -8.63 | -2.83% | 206.11 | 90.55 | 43.93% |
| 31.08.2011 | 305.30 | 319.78 | -14.48 | -4.53% | 205.85 | 99.45 | 48.31% |
| 31.07.2011 | 319.78 | 324.74 | -4.96 | -1.53% | 204.19 | 115.59 | 56.61% |
| 30.06.2011 | 324.74 | 275.54 | 49.20 | 17.86% | 206.04 | 118.70 | 57.61% |
| 31.05.2011 | 275.54 | 268.30 | 7.24 | 2.70% | 207.81 | 67.73 | 32.59% |
| 30.04.2011 | 268.30 | 289.73 | -21.43 | -7.40% | 213.97 | 54.33 | 25.39% |
| 31.03.2011 | 289.73 | 278.75 | 10.98 | 3.94% | 197.48 | 92.25 | 46.71% |
| 28.02.2011 | 278.75 | 256.09 | 22.66 | 8.85% | 202.37 | 76.38 | 37.74% |
| 31.01.2011 | 256.09 | 248.83 | 7.26 | 2.92% | 191.26 | 64.83 | 33.90% |
| 31.12.2010 | 248.83 | 223.92 | 24.91 | 11.12% | 196.71 | 52.12 | 26.50% |
| 30.11.2010 | 223.92 | 209.16 | 14.76 | 7.06% | 190.09 | 33.83 | 17.80% |
| 31.10.2010 | 209.16 | 206.11 | 3.04 | 1.48% | 191.89 | 17.27 | 9.00% |
| 30.09.2010 | 206.11 | 205.85 | 0.26 | 0.13% | 176.97 | 29.14 | 16.47% |
| 31.08.2010 | 205.85 | 204.19 | 1.65 | 0.81% | 145.53 | 60.32 | 41.45% |
| 31.07.2010 | 204.19 | 206.04 | -1.84 | -0.89% | 140.37 | 63.83 | 45.47% |
| 30.06.2010 | 206.04 | 207.81 | -1.77 | -0.85% | 152.12 | 53.92 | 35.45% |
| 31.05.2010 | 207.81 | 213.97 | -6.16 | -2.88% | 162.67 | 45.14 | 27.75% |
| 30.04.2010 | 213.97 | 197.48 | 16.49 | 8.35% | 160.25 | 53.73 | 33.53% |
| 31.03.2010 | 197.48 | 202.37 | -4.89 | -2.42% | 158.17 | 39.31 | 24.85% |
| 28.02.2010 | 202.37 | 191.26 | 11.11 | 5.81% | 176.78 | 25.59 | 14.48% |
| 31.01.2010 | 191.26 | 196.71 | -5.44 | -2.77% | 186.04 | 5.22 | 2.81% |
| 31.12.2009 | 196.71 | 190.09 | 6.62 | 3.48% | 185.16 | 11.55 | 6.24% |
| 30.11.2009 | 190.09 | 191.89 | -1.81 | -0.94% | 120.57 | 69.51 | 57.65% |
| 31.10.2009 | 191.89 | 176.97 | 14.93 | 8.43% | 120.57 | 71.32 | 59.15% |
| 30.09.2009 | 176.97 | 145.53 | 31.44 | 21.60% | 120.57 | 56.40 | 46.77% |
| 31.08.2009 | 145.53 | 140.37 | 5.16 | 3.68% | 109.62 | 35.91 | 32.76% |
| 31.07.2009 | 140.37 | 152.12 | -11.75 | -7.72% | 109.62 | 30.75 | 28.05% |
| 30.06.2009 | 152.12 | 162.67 | -10.55 | -6.49% | 109.62 | 42.50 | 38.77% |
| 31.05.2009 | 162.67 | 160.25 | 2.42 | 1.51% | 113.11 | 49.56 | 43.82% |
| 30.04.2009 | 160.25 | 158.17 | 2.08 | 1.31% | 113.11 | 47.14 | 41.67% |
| 31.03.2009 | 158.17 | 176.78 | -18.61 | -10.53% | 113.11 | 45.06 | 39.84% |
| 28.02.2009 | 176.78 | 186.04 | -9.26 | -4.98% | 198.17 | -21.39 | -10.79% |
| 31.01.2009 | 186.04 | 185.16 | 0.88 | 0.48% | 198.17 | -12.13 | -6.12% |
| 31.12.2008 | 185.16 | 120.57 | 64.58 | 53.56% | 198.17 | -13.01 | -6.57% |
| 30.09.2008 | 120.57 | 109.62 | 10.96 | 10.00% | 232.91 | - 112.34 | -48.23% |
| 30.06.2008 | 109.62 | 113.11 | -3.49 | -3.09% | 219.43 | - 109.81 | -50.04% |
| 31.03.2008 | 113.11 | 198.17 | -85.06 | -42.92% | 156.90 | -43.79 | -27.91% |
| 31.12.2007 | 198.17 | 232.91 | -34.74 | -14.92% | 97.23 | 100.94 | 103.82% |
| 30.09.2007 | 232.91 | 219.43 | 13.49 | 6.15% | 168.22 | 64.69 | 38.45% |
| 30.06.2007 | 219.43 | 156.90 | 62.53 | 39.85% | 119.95 | 99.47 | 82.92% |
| 31.03.2007 | 156.90 | 97.23 | 59.67 | 61.37% | 41.14 | 115.76 | 281.38% |
| 31.12.2006 | 97.23 | 168.22 | -71.00 | -42.20% | 0.00 | 97.23 | - |
| 30.09.2006 | 168.22 | 119.95 | 48.27 | 40.24% | 0.00 | 168.22 | - |
| 30.06.2006 | 119.95 | 41.14 | 78.81 | 191.58% | 0.00 | 119.95 | - |
| 31.03.2006 | 41.14 | 0.00 | 41.14 | - | 0.00 | 41.14 | - |
| 31.12.2005 | 0.00 | 0.00 | 0.00 | - | 0.00 | 0.00 | - |
| 30.09.2005 | 0.00 | 0.00 | 0.00 | - | 0.00 | 0.00 | - |
| 30.06.2005 | 0.00 | 0.00 | 0.00 | - | - | - | - |
| 31.03.2005 | 0.00 | 0.00 | 0.00 | - | - | - | - |
| 31.12.2004 | 0.00 | 0.00 | 0.00 | - | - | - | - |
| 30.09.2004 | 0.00 | - | - | - | - | - | - |
Graf jako obrázek

Podobné sestavy
Aplikace Ekonomika ČNB ze sekce makroekonomika zobrazuje časové řady hlavních makroekonomických údajů z ekonomiky ČR. Najdete zde přes 10.000 grafů různých hodnot od úrokových sazeb, přes statistiky státního rozpočtu, statistiky ČNB a data zpracovávaná ČSÚ. Data jsou k dispozici obvykle za posledních více než 20 let, od prosince roku 1992. Zdroj dat: ČNB ARAD

