Mutual funds shares/units issued (Real estate funds balance sheet) - ekonomika ČNB
Aktualizace dat Mutual funds shares/units issued (Real estate funds balance sheet) v této aplikaci skončila 30.6.2023. Aktualizovná data časových řad najdete na stránkách nové aplikace z dat ARAD ČNB
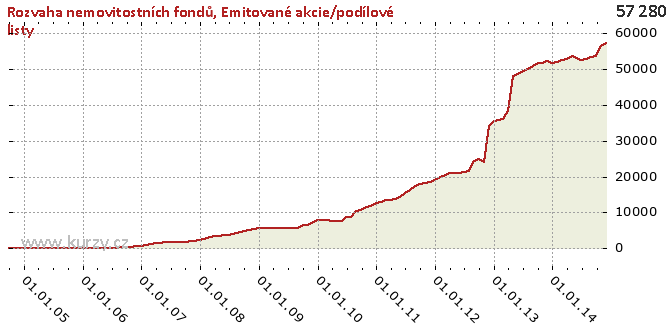
Graf hodnot, Real estate funds balance sheet
Meziroční srovnání
Minima a maxima
| Typ | Období | Hodnota |
|---|---|---|
| Max | 30.11.2014 | 57 280.99 |
| Min | 31.03.2006 | 56.94 |
Historické hodnoty
| Období | Hodnota | Předchozí | Rozdíl | Změna | Před rokem | Rozdíl | Změna |
|---|---|---|---|---|---|---|---|
| 30.11.2014 | 57 280.99 | 56 244.48 | 1 036.51 | 1.84% | 52 119.29 | 5 161.70 | 9.90% |
| 31.10.2014 | 56 244.48 | 53 574.46 | 2 670.02 | 4.98% | 51 735.21 | 4 509.27 | 8.72% |
| 30.09.2014 | 53 574.46 | 53 237.05 | 337.41 | 0.63% | 51 541.08 | 2 033.37 | 3.95% |
| 31.08.2014 | 53 237.05 | 52 626.15 | 610.89 | 1.16% | 50 680.67 | 2 556.38 | 5.04% |
| 31.07.2014 | 52 626.15 | 52 507.60 | 118.56 | 0.23% | 49 856.93 | 2 769.23 | 5.55% |
| 30.06.2014 | 52 507.60 | 52 988.35 | - 480.75 | -0.91% | 49 401.97 | 3 105.63 | 6.29% |
| 31.05.2014 | 52 988.35 | 53 422.32 | - 433.97 | -0.81% | 48 505.54 | 4 482.81 | 9.24% |
| 30.04.2014 | 53 422.32 | 52 691.02 | 731.30 | 1.39% | 48 007.55 | 5 414.77 | 11.28% |
| 31.03.2014 | 52 691.02 | 52 338.06 | 352.96 | 0.67% | 38 134.40 | 14 556.62 | 38.17% |
| 28.02.2014 | 52 338.06 | 51 969.72 | 368.34 | 0.71% | 36 018.65 | 16 319.41 | 45.31% |
| 31.01.2014 | 51 969.72 | 51 565.24 | 404.48 | 0.78% | 35 661.47 | 16 308.25 | 45.73% |
| 31.12.2013 | 51 565.24 | 52 119.29 | - 554.05 | -1.06% | 35 493.06 | 16 072.18 | 45.28% |
| 30.11.2013 | 52 119.29 | 51 735.21 | 384.08 | 0.74% | 34 007.73 | 18 111.56 | 53.26% |
| 31.10.2013 | 51 735.21 | 51 541.08 | 194.12 | 0.38% | 24 161.18 | 27 574.03 | 114.13% |
| 30.09.2013 | 51 541.08 | 50 680.67 | 860.41 | 1.70% | 24 778.77 | 26 762.31 | 108.00% |
| 31.08.2013 | 50 680.67 | 49 856.93 | 823.75 | 1.65% | 24 223.12 | 26 457.56 | 109.22% |
| 31.07.2013 | 49 856.93 | 49 401.97 | 454.95 | 0.92% | 21 593.12 | 28 263.80 | 130.89% |
| 30.06.2013 | 49 401.97 | 48 505.54 | 896.43 | 1.85% | 21 302.87 | 28 099.10 | 131.90% |
| 31.05.2013 | 48 505.54 | 48 007.55 | 497.99 | 1.04% | 21 126.44 | 27 379.10 | 129.60% |
| 30.04.2013 | 48 007.55 | 38 134.40 | 9 873.16 | 25.89% | 21 070.83 | 26 936.73 | 127.84% |
| 31.03.2013 | 38 134.40 | 36 018.65 | 2 115.75 | 5.87% | 21 018.53 | 17 115.87 | 81.43% |
| 28.02.2013 | 36 018.65 | 35 661.47 | 357.18 | 1.00% | 20 173.15 | 15 845.50 | 78.55% |
| 31.01.2013 | 35 661.47 | 35 493.06 | 168.41 | 0.47% | 19 826.44 | 15 835.03 | 79.87% |
| 31.12.2012 | 35 493.06 | 34 007.73 | 1 485.33 | 4.37% | 18 932.43 | 16 560.63 | 87.47% |
| 30.11.2012 | 34 007.73 | 24 161.18 | 9 846.55 | 40.75% | 18 349.78 | 15 657.96 | 85.33% |
| 31.10.2012 | 24 161.18 | 24 778.77 | - 617.60 | -2.49% | 18 212.46 | 5 948.72 | 32.66% |
| 30.09.2012 | 24 778.77 | 24 223.12 | 555.66 | 2.29% | 17 996.87 | 6 781.90 | 37.68% |
| 31.08.2012 | 24 223.12 | 21 593.12 | 2 629.99 | 12.18% | 17 288.22 | 6 934.90 | 40.11% |
| 31.07.2012 | 21 593.12 | 21 302.87 | 290.26 | 1.36% | 16 317.54 | 5 275.59 | 32.33% |
| 30.06.2012 | 21 302.87 | 21 126.44 | 176.42 | 0.83% | 15 305.33 | 5 997.53 | 39.19% |
| 31.05.2012 | 21 126.44 | 21 070.83 | 55.62 | 0.26% | 14 444.25 | 6 682.19 | 46.26% |
| 30.04.2012 | 21 070.83 | 21 018.53 | 52.30 | 0.25% | 13 716.76 | 7 354.07 | 53.61% |
| 31.03.2012 | 21 018.53 | 20 173.15 | 845.38 | 4.19% | 13 546.60 | 7 471.93 | 55.16% |
| 29.02.2012 | 20 173.15 | 19 826.44 | 346.71 | 1.75% | 13 411.37 | 6 761.78 | 50.42% |
| 31.01.2012 | 19 826.44 | 18 932.43 | 894.01 | 4.72% | 12 845.56 | 6 980.88 | 54.34% |
| 31.12.2011 | 18 932.43 | 18 349.78 | 582.66 | 3.18% | 12 645.15 | 6 287.28 | 49.72% |
| 30.11.2011 | 18 349.78 | 18 212.46 | 137.31 | 0.75% | 11 803.80 | 6 545.97 | 55.46% |
| 31.10.2011 | 18 212.46 | 17 996.87 | 215.59 | 1.20% | 11 633.94 | 6 578.52 | 56.55% |
| 30.09.2011 | 17 996.87 | 17 288.22 | 708.65 | 4.10% | 10 626.78 | 7 370.09 | 69.35% |
| 31.08.2011 | 17 288.22 | 16 317.54 | 970.68 | 5.95% | 10 516.69 | 6 771.53 | 64.39% |
| 31.07.2011 | 16 317.54 | 15 305.33 | 1 012.21 | 6.61% | 8 866.72 | 7 450.81 | 84.03% |
| 30.06.2011 | 15 305.33 | 14 444.25 | 861.08 | 5.96% | 8 822.43 | 6 482.91 | 73.48% |
| 31.05.2011 | 14 444.25 | 13 716.76 | 727.49 | 5.30% | 7 553.87 | 6 890.39 | 91.22% |
| 30.04.2011 | 13 716.76 | 13 546.60 | 170.16 | 1.26% | 7 730.99 | 5 985.76 | 77.43% |
| 31.03.2011 | 13 546.60 | 13 411.37 | 135.23 | 1.01% | 7 500.78 | 6 045.82 | 80.60% |
| 28.02.2011 | 13 411.37 | 12 845.56 | 565.81 | 4.40% | 7 934.77 | 5 476.60 | 69.02% |
| 31.01.2011 | 12 845.56 | 12 645.15 | 200.41 | 1.58% | 7 868.41 | 4 977.15 | 63.25% |
| 31.12.2010 | 12 645.15 | 11 803.80 | 841.35 | 7.13% | 7 779.60 | 4 865.56 | 62.54% |
| 30.11.2010 | 11 803.80 | 11 633.94 | 169.87 | 1.46% | 7 148.92 | 4 654.89 | 65.11% |
| 31.10.2010 | 11 633.94 | 10 626.78 | 1 007.16 | 9.48% | 6 471.07 | 5 162.86 | 79.78% |
| 30.09.2010 | 10 626.78 | 10 516.69 | 110.09 | 1.05% | 6 447.35 | 4 179.43 | 64.82% |
| 31.08.2010 | 10 516.69 | 8 866.72 | 1 649.97 | 18.61% | 5 734.38 | 4 782.31 | 83.40% |
| 31.07.2010 | 8 866.72 | 8 822.43 | 44.30 | 0.50% | 5 650.52 | 3 216.20 | 56.92% |
| 30.06.2010 | 8 822.43 | 7 553.87 | 1 268.56 | 16.79% | 5 614.44 | 3 207.99 | 57.14% |
| 31.05.2010 | 7 553.87 | 7 730.99 | - 177.13 | -2.29% | 5 609.23 | 1 944.64 | 34.67% |
| 30.04.2010 | 7 730.99 | 7 500.78 | 230.22 | 3.07% | 5 593.67 | 2 137.32 | 38.21% |
| 31.03.2010 | 7 500.78 | 7 934.77 | - 434.00 | -5.47% | 5 673.15 | 1 827.63 | 32.22% |
| 28.02.2010 | 7 934.77 | 7 868.41 | 66.36 | 0.84% | 5 689.95 | 2 244.83 | 39.45% |
| 31.01.2010 | 7 868.41 | 7 779.60 | 88.81 | 1.14% | 5 783.10 | 2 085.31 | 36.06% |
| 31.12.2009 | 7 779.60 | 7 148.92 | 630.68 | 8.82% | 5 816.98 | 1 962.61 | 33.74% |
| 30.11.2009 | 7 148.92 | 6 471.07 | 677.84 | 10.47% | 4 746.30 | 2 402.62 | 50.62% |
| 31.10.2009 | 6 471.07 | 6 447.35 | 23.73 | 0.37% | 4 746.30 | 1 724.78 | 36.34% |
| 30.09.2009 | 6 447.35 | 5 734.38 | 712.97 | 12.43% | 4 746.30 | 1 701.05 | 35.84% |
| 31.08.2009 | 5 734.38 | 5 650.52 | 83.85 | 1.48% | 3 692.94 | 2 041.44 | 55.28% |
| 31.07.2009 | 5 650.52 | 5 614.44 | 36.09 | 0.64% | 3 692.94 | 1 957.59 | 53.01% |
| 30.06.2009 | 5 614.44 | 5 609.23 | 5.21 | 0.09% | 3 692.94 | 1 921.50 | 52.03% |
| 31.05.2009 | 5 609.23 | 5 593.67 | 15.56 | 0.28% | 3 324.97 | 2 284.26 | 68.70% |
| 30.04.2009 | 5 593.67 | 5 673.15 | -79.47 | -1.40% | 3 324.97 | 2 268.70 | 68.23% |
| 31.03.2009 | 5 673.15 | 5 689.95 | -16.80 | -0.30% | 3 324.97 | 2 348.17 | 70.62% |
| 28.02.2009 | 5 689.95 | 5 783.10 | -93.15 | -1.61% | 2 322.78 | 3 367.17 | 144.96% |
| 31.01.2009 | 5 783.10 | 5 816.98 | -33.88 | -0.58% | 2 322.78 | 3 460.33 | 148.97% |
| 31.12.2008 | 5 816.98 | 4 746.30 | 1 070.69 | 22.56% | 2 322.78 | 3 494.21 | 150.43% |
| 30.09.2008 | 4 746.30 | 3 692.94 | 1 053.36 | 28.52% | 1 857.15 | 2 889.14 | 155.57% |
| 30.06.2008 | 3 692.94 | 3 324.97 | 367.96 | 11.07% | 1 884.67 | 1 808.27 | 95.95% |
| 31.03.2008 | 3 324.97 | 2 322.78 | 1 002.20 | 43.15% | 1 442.93 | 1 882.04 | 130.43% |
| 31.12.2007 | 2 322.78 | 1 857.15 | 465.62 | 25.07% | 557.26 | 1 765.51 | 316.82% |
| 30.09.2007 | 1 857.15 | 1 884.67 | -27.52 | -1.46% | 351.72 | 1 505.43 | 428.02% |
| 30.06.2007 | 1 884.67 | 1 442.93 | 441.73 | 30.61% | 251.62 | 1 633.05 | 649.03% |
| 31.03.2007 | 1 442.93 | 557.26 | 885.67 | 158.93% | 56.94 | 1 385.99 | 2 434.00% |
| 31.12.2006 | 557.26 | 351.72 | 205.54 | 58.44% | 0.00 | 557.26 | - |
| 30.09.2006 | 351.72 | 251.62 | 100.11 | 39.79% | 0.00 | 351.72 | - |
| 30.06.2006 | 251.62 | 56.94 | 194.67 | 341.87% | 0.00 | 251.62 | - |
| 31.03.2006 | 56.94 | 0.00 | 56.94 | - | 0.00 | 56.94 | - |
| 31.12.2005 | 0.00 | 0.00 | 0.00 | - | 0.00 | 0.00 | - |
| 30.09.2005 | 0.00 | 0.00 | 0.00 | - | 0.00 | 0.00 | - |
| 30.06.2005 | 0.00 | 0.00 | 0.00 | - | - | - | - |
| 31.03.2005 | 0.00 | 0.00 | 0.00 | - | - | - | - |
| 31.12.2004 | 0.00 | 0.00 | 0.00 | - | - | - | - |
| 30.09.2004 | 0.00 | - | - | - | - | - | - |
Graf jako obrázek

Podobné sestavy
Aplikace Ekonomika ČNB ze sekce makroekonomika zobrazuje časové řady hlavních makroekonomických údajů z ekonomiky ČR. Najdete zde přes 10.000 grafů různých hodnot od úrokových sazeb, přes statistiky státního rozpočtu, statistiky ČNB a data zpracovávaná ČSÚ. Data jsou k dispozici obvykle za posledních více než 20 let, od prosince roku 1992. Zdroj dat: ČNB ARAD

