Investment fund shares/units (Real estate funds balance sheet - flows) - ekonomika ČNB
Aktualizace dat Investment fund shares/units (Real estate funds balance sheet - flows) v této aplikaci skončila 30.6.2023. Aktualizovná data časových řad najdete na stránkách nové aplikace z dat ARAD ČNB
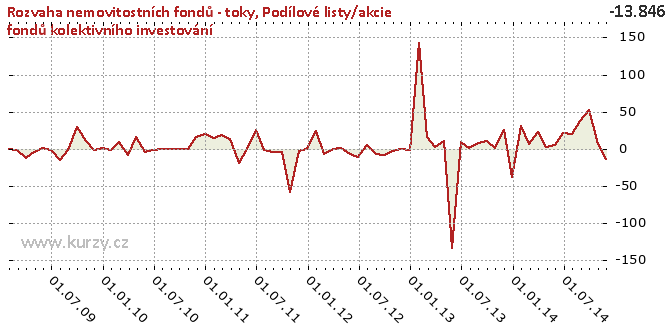
Graf hodnot, Real estate funds balance sheet - flows
Meziroční srovnání
Minima a maxima
| Typ | Období | Hodnota |
|---|---|---|
| Min | 31.05.2013 | - 134.82 |
| Max | 31.01.2013 | 143.12 |
Historické hodnoty
| Období | Hodnota | Předchozí | Rozdíl | Změna | Před rokem | Rozdíl | Změna |
|---|---|---|---|---|---|---|---|
| 30.11.2014 | -13.85 | 6.13 | -19.98 | - 325.91% | 24.70 | -38.55 | - 156.06% |
| 31.10.2014 | 6.13 | 51.51 | -45.38 | -88.10% | 1.22 | 4.91 | 402.38% |
| 30.09.2014 | 51.51 | 36.97 | 14.54 | 39.34% | 10.10 | 41.41 | 410.23% |
| 31.08.2014 | 36.97 | 20.20 | 16.77 | 83.02% | 7.77 | 29.19 | 375.52% |
| 31.07.2014 | 20.20 | 21.09 | -0.90 | -4.25% | 0.58 | 19.62 | 3 406.60% |
| 30.06.2014 | 21.09 | 5.19 | 15.90 | 306.51% | 9.03 | 12.06 | 133.60% |
| 31.05.2014 | 5.19 | 1.69 | 3.50 | 207.77% | - 134.82 | 140.01 | - 103.85% |
| 30.04.2014 | 1.69 | 23.05 | -21.36 | -92.69% | 9.73 | -8.04 | -82.67% |
| 31.03.2014 | 23.05 | 5.81 | 17.24 | 296.75% | 1.52 | 21.53 | 1 415.52% |
| 28.02.2014 | 5.81 | 31.12 | -25.31 | -81.33% | 16.04 | -10.23 | -63.77% |
| 31.01.2014 | 31.12 | -38.82 | 69.94 | - 180.17% | 143.12 | - 112.00 | -78.25% |
| 31.12.2013 | -38.82 | 24.70 | -63.52 | - 257.17% | -1.35 | -37.47 | 2 767.21% |
| 30.11.2013 | 24.70 | 1.22 | 23.48 | 1 924.59% | 0.00 | 24.70 | - |
| 31.10.2013 | 1.22 | 10.10 | -8.88 | -87.91% | -3.07 | 4.29 | - 139.71% |
| 30.09.2013 | 10.10 | 7.77 | 2.32 | 29.86% | -8.18 | 18.27 | - 223.43% |
| 31.08.2013 | 7.77 | 0.58 | 7.20 | 1 249.65% | -6.88 | 14.66 | - 212.94% |
| 31.07.2013 | 0.58 | 9.03 | -8.45 | -93.62% | 4.99 | -4.41 | -88.45% |
| 30.06.2013 | 9.03 | - 134.82 | 143.85 | - 106.70% | -11.23 | 20.26 | - 180.42% |
| 31.05.2013 | - 134.82 | 9.73 | - 144.55 | -1 485.50% | -6.90 | - 127.92 | 1 853.96% |
| 30.04.2013 | 9.73 | 1.52 | 8.21 | 539.78% | 1.12 | 8.61 | 771.17% |
| 31.03.2013 | 1.52 | 16.04 | -14.52 | -90.52% | 0.00 | 1.52 | - |
| 28.02.2013 | 16.04 | 143.12 | - 127.08 | -88.79% | -7.50 | 23.54 | - 313.77% |
| 31.01.2013 | 143.12 | -1.35 | 144.47 | -10 670.16% | 23.10 | 120.02 | 519.62% |
| 31.12.2012 | -1.35 | 0.00 | -1.35 | - | -0.30 | -1.05 | 351.33% |
| 30.11.2012 | 0.00 | -3.07 | 3.07 | - | -2.88 | 2.88 | - |
| 31.10.2012 | -3.07 | -8.18 | 5.11 | -62.44% | -58.10 | 55.02 | -94.71% |
| 30.09.2012 | -8.18 | -6.88 | -1.30 | 18.83% | -4.85 | -3.33 | 68.50% |
| 31.08.2012 | -6.88 | 4.99 | -11.87 | - 238.02% | -4.77 | -2.12 | 44.39% |
| 31.07.2012 | 4.99 | -11.23 | 16.21 | - 144.42% | -2.45 | 7.44 | - 303.63% |
| 30.06.2012 | -11.23 | -6.90 | -4.33 | 62.72% | 24.43 | -35.66 | - 145.95% |
| 31.05.2012 | -6.90 | 1.12 | -8.02 | - 717.73% | 0.00 | -6.90 | - |
| 30.04.2012 | 1.12 | 0.00 | 1.12 | - | -19.10 | 20.22 | - 105.85% |
| 31.03.2012 | 0.00 | -7.50 | 7.50 | - | 12.40 | -12.40 | - |
| 29.02.2012 | -7.50 | 23.10 | -30.60 | - 132.48% | 18.29 | -25.79 | - 141.02% |
| 31.01.2012 | 23.10 | -0.30 | 23.40 | -7 799.33% | 13.90 | 9.20 | 66.18% |
| 31.12.2011 | -0.30 | -2.88 | 2.58 | -89.58% | 19.62 | -19.92 | - 101.53% |
| 30.11.2011 | -2.88 | -58.10 | 55.22 | -95.04% | 15.54 | -18.42 | - 118.53% |
| 31.10.2011 | -58.10 | -4.85 | -53.24 | 1 096.89% | 0.00 | -58.10 | - |
| 30.09.2011 | -4.85 | -4.77 | -0.09 | 1.82% | 0.00 | -4.85 | - |
| 31.08.2011 | -4.77 | -2.45 | -2.32 | 94.65% | 0.00 | -4.77 | - |
| 31.07.2011 | -2.45 | 24.43 | -26.88 | - 110.02% | 0.00 | -2.45 | - |
| 30.06.2011 | 24.43 | 0.00 | 24.43 | - | -1.76 | 26.19 | -1 491.51% |
| 31.05.2011 | 0.00 | -19.10 | 19.10 | - | -4.01 | 4.01 | - |
| 30.04.2011 | -19.10 | 12.40 | -31.50 | - 254.09% | 15.45 | -34.55 | - 223.63% |
| 31.03.2011 | 12.40 | 18.29 | -5.89 | -32.23% | -9.28 | 21.67 | - 233.65% |
| 28.02.2011 | 18.29 | 13.90 | 4.39 | 31.59% | 8.99 | 9.30 | 103.45% |
| 31.01.2011 | 13.90 | 19.62 | -5.72 | -29.17% | -2.27 | 16.17 | - 712.56% |
| 31.12.2010 | 19.62 | 15.54 | 4.08 | 26.26% | 0.17 | 19.45 | 11 177.01% |
| 30.11.2010 | 15.54 | 0.00 | 15.54 | - | -1.25 | 16.80 | -1 338.33% |
| 31.10.2010 | 0.00 | 0.00 | 0.00 | - | 9.91 | -9.91 | - |
| 30.09.2010 | 0.00 | 0.00 | 0.00 | - | 29.80 | -29.80 | - |
| 31.08.2010 | 0.00 | 0.00 | 0.00 | - | -2.17 | 2.17 | - |
| 31.07.2010 | 0.00 | -1.76 | 1.76 | - | -15.08 | 15.08 | - |
| 30.06.2010 | -1.76 | -4.01 | 2.25 | -56.19% | -2.44 | 0.68 | -27.97% |
| 31.05.2010 | -4.01 | 15.45 | -19.46 | - 125.94% | 0.78 | -4.79 | - 611.88% |
| 30.04.2010 | 15.45 | -9.28 | 24.73 | - 266.58% | -4.08 | 19.53 | - 479.05% |
| 31.03.2010 | -9.28 | 8.99 | -18.27 | - 203.17% | -12.43 | 3.15 | -25.38% |
| 28.02.2010 | 8.99 | -2.27 | 11.26 | - 496.21% | -2.20 | 11.19 | - 508.08% |
| 31.01.2010 | -2.27 | 0.17 | -2.44 | -1 404.02% | 0.00 | -2.27 | - |
| 31.12.2009 | 0.17 | -1.25 | 1.43 | - 113.86% | - | - | - |
| 30.11.2009 | -1.25 | 9.91 | -11.16 | - 112.67% | - | - | - |
| 31.10.2009 | 9.91 | 29.80 | -19.90 | -66.76% | - | - | - |
| 30.09.2009 | 29.80 | -2.17 | 31.97 | -1 476.58% | - | - | - |
| 31.08.2009 | -2.17 | -15.08 | 12.91 | -85.64% | - | - | - |
| 31.07.2009 | -15.08 | -2.44 | -12.64 | 518.54% | - | - | - |
| 30.06.2009 | -2.44 | 0.78 | -3.22 | - 411.37% | - | - | - |
| 31.05.2009 | 0.78 | -4.08 | 4.86 | - 119.21% | - | - | - |
| 30.04.2009 | -4.08 | -12.43 | 8.35 | -67.21% | - | - | - |
| 31.03.2009 | -12.43 | -2.20 | -10.23 | 464.23% | - | - | - |
| 28.02.2009 | -2.20 | 0.00 | -2.20 | - | - | - | - |
| 31.01.2009 | 0.00 | - | - | - | - | - | - |
Graf jako obrázek

Podobné sestavy
Aplikace Ekonomika ČNB ze sekce makroekonomika zobrazuje časové řady hlavních makroekonomických údajů z ekonomiky ČR. Najdete zde přes 10.000 grafů různých hodnot od úrokových sazeb, přes statistiky státního rozpočtu, statistiky ČNB a data zpracovávaná ČSÚ. Data jsou k dispozici obvykle za posledních více než 20 let, od prosince roku 1992. Zdroj dat: ČNB ARAD

