Other assets (Real Estate Funds Balance Sheet - Flows) - ekonomika ČNB
Aktualizace dat Other assets (Real Estate Funds Balance Sheet - Flows) v této aplikaci skončila 30.6.2023. Aktualizovná data časových řad najdete na stránkách nové aplikace z dat ARAD ČNB
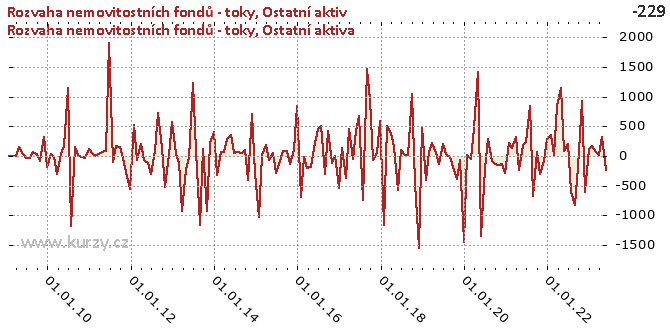
Graf hodnot, Real Estate Funds Balance Sheet - Flows
Meziroční srovnání
Minima a maxima
| Typ | Období | Hodnota |
|---|---|---|
| Min | 31.05.2020 | -2 033.00 |
| Max | 30.06.2011 | 1 908.36 |
Historické hodnoty
| Období | Hodnota | Předchozí | Rozdíl | Změna | Před rokem | Rozdíl | Změna |
|---|---|---|---|---|---|---|---|
| 30.06.2020 | - 294.67 | -2 033.00 | 1 738.33 | -85.51% | 194.91 | - 489.58 | - 251.19% |
| 31.05.2020 | -2 033.00 | 1 393.38 | -3 426.39 | - 245.90% | - 139.66 | -1 893.35 | 1 355.73% |
| 30.04.2020 | 1 393.38 | 74.94 | 1 318.44 | 1 759.36% | 53.33 | 1 340.06 | 2 512.85% |
| 31.03.2020 | 74.94 | - 225.91 | 300.85 | - 133.17% | 213.78 | - 138.84 | -64.95% |
| 29.02.2020 | - 225.91 | -49.12 | - 176.79 | 359.91% | 59.61 | - 285.52 | - 478.96% |
| 31.01.2020 | -49.12 | -62.83 | 13.70 | -21.81% | - 411.55 | 362.43 | -88.06% |
| 31.12.2019 | -62.83 | -73.81 | 10.98 | -14.88% | 481.71 | - 544.53 | - 113.04% |
| 30.11.2019 | -73.81 | - 392.17 | 318.36 | -81.18% | -1 554.41 | 1 480.61 | -95.25% |
| 31.10.2019 | - 392.17 | - 177.79 | - 214.38 | 120.58% | - 446.93 | 54.76 | -12.25% |
| 30.09.2019 | - 177.79 | -19.33 | - 158.46 | 819.61% | 1 043.61 | -1 221.40 | - 117.04% |
| 31.08.2019 | -19.33 | 26.69 | -46.03 | - 172.43% | 12.41 | -31.74 | - 255.80% |
| 31.07.2019 | 26.69 | 194.91 | - 168.22 | -86.30% | 20.66 | 6.03 | 29.18% |
| 30.06.2019 | 194.91 | - 139.66 | 334.56 | - 239.56% | 98.47 | 96.44 | 97.94% |
| 31.05.2019 | - 139.66 | 53.33 | - 192.98 | - 361.88% | - 563.68 | 424.02 | -75.22% |
| 30.04.2019 | 53.33 | 213.78 | - 160.46 | -75.06% | 145.13 | -91.80 | -63.26% |
| 31.03.2019 | 213.78 | 59.61 | 154.17 | 258.62% | 390.23 | - 176.45 | -45.22% |
| 28.02.2019 | 59.61 | - 411.55 | 471.16 | - 114.48% | 496.82 | - 437.21 | -88.00% |
| 31.01.2019 | - 411.55 | 481.71 | - 893.26 | - 185.44% | -1 159.41 | 747.86 | -64.50% |
| 31.12.2018 | 481.71 | -1 554.41 | 2 036.12 | - 130.99% | 581.20 | -99.50 | -17.12% |
| 30.11.2018 | -1 554.41 | - 446.93 | -1 107.48 | 247.80% | 45.31 | -1 599.72 | -3 530.92% |
| 31.10.2018 | - 446.93 | 1 043.61 | -1 490.54 | - 142.83% | -63.94 | - 382.99 | 598.96% |
| 30.09.2018 | 1 043.61 | 12.41 | 1 031.20 | 8 310.11% | 946.61 | 97.00 | 10.25% |
| 31.08.2018 | 12.41 | 20.66 | -8.26 | -39.95% | 1 462.94 | -1 450.53 | -99.15% |
| 31.07.2018 | 20.66 | 98.47 | -77.80 | -79.01% | - 743.80 | 764.47 | - 102.78% |
| 30.06.2018 | 98.47 | - 563.68 | 662.14 | - 117.47% | 674.71 | - 576.24 | -85.41% |
| 31.05.2018 | - 563.68 | 145.13 | - 708.81 | - 488.39% | 425.79 | - 989.47 | - 232.38% |
| 30.04.2018 | 145.13 | 390.23 | - 245.10 | -62.81% | -43.81 | 188.94 | - 431.25% |
| 31.03.2018 | 390.23 | 496.82 | - 106.59 | -21.45% | 462.55 | -72.32 | -15.63% |
| 28.02.2018 | 496.82 | -1 159.41 | 1 656.23 | - 142.85% | - 372.62 | 869.44 | - 233.33% |
| 31.01.2018 | -1 159.41 | 581.20 | -1 740.62 | - 299.49% | 138.48 | -1 297.90 | - 937.22% |
| 31.12.2017 | 581.20 | 45.31 | 535.90 | 1 182.84% | - 530.26 | 1 111.46 | - 209.61% |
| 30.11.2017 | 45.31 | -63.94 | 109.25 | - 170.85% | -3.59 | 48.90 | -1 360.60% |
| 31.10.2017 | -63.94 | 946.61 | -1 010.55 | - 106.75% | - 115.37 | 51.43 | -44.58% |
| 30.09.2017 | 946.61 | 1 462.94 | - 516.33 | -35.29% | 421.28 | 525.33 | 124.70% |
| 31.08.2017 | 1 462.94 | - 743.80 | 2 206.74 | - 296.68% | - 297.44 | 1 760.38 | - 591.83% |
| 31.07.2017 | - 743.80 | 674.71 | -1 418.51 | - 210.24% | 505.77 | -1 249.57 | - 247.06% |
| 30.06.2017 | 674.71 | 425.79 | 248.92 | 58.46% | 458.86 | 215.85 | 47.04% |
| 31.05.2017 | 425.79 | -43.81 | 469.61 | -1 071.84% | 130.20 | 295.60 | 227.04% |
| 30.04.2017 | -43.81 | 462.55 | - 506.37 | - 109.47% | - 181.98 | 138.17 | -75.92% |
| 31.03.2017 | 462.55 | - 372.62 | 835.17 | - 224.14% | - 204.59 | 667.14 | - 326.09% |
| 28.02.2017 | - 372.62 | 138.48 | - 511.10 | - 369.07% | -22.41 | - 350.20 | 1 562.43% |
| 31.01.2017 | 138.48 | - 530.26 | 668.74 | - 126.12% | - 689.81 | 828.29 | - 120.08% |
| 31.12.2016 | - 530.26 | -3.59 | - 526.66 | 14 654.01% | 846.90 | -1 377.15 | - 162.61% |
| 30.11.2016 | -3.59 | - 115.37 | 111.78 | -96.88% | 99.86 | - 103.46 | - 103.60% |
| 31.10.2016 | - 115.37 | 421.28 | - 536.65 | - 127.39% | - 133.02 | 17.64 | -13.26% |
| 30.09.2016 | 421.28 | - 297.44 | 718.72 | - 241.63% | 77.60 | 343.68 | 442.90% |
| 31.08.2016 | - 297.44 | 505.77 | - 803.21 | - 158.81% | 90.19 | - 387.64 | - 429.78% |
| 31.07.2016 | 505.77 | 458.86 | 46.91 | 10.22% | -78.85 | 584.62 | - 741.43% |
| 30.06.2016 | 458.86 | 130.20 | 328.66 | 252.43% | - 288.98 | 747.84 | - 258.78% |
| 31.05.2016 | 130.20 | - 181.98 | 312.18 | - 171.54% | 42.74 | 87.45 | 204.60% |
| 30.04.2016 | - 181.98 | - 204.59 | 22.61 | -11.05% | -63.41 | - 118.57 | 186.98% |
| 31.03.2016 | - 204.59 | -22.41 | - 182.17 | 812.76% | 184.98 | - 389.56 | - 210.60% |
| 29.02.2016 | -22.41 | - 689.81 | 667.39 | -96.75% | 19.78 | -42.20 | - 213.31% |
| 31.01.2016 | - 689.81 | 846.90 | -1 536.70 | - 181.45% | -1 028.46 | 338.65 | -32.93% |
| 31.12.2015 | 846.90 | 99.86 | 747.03 | 748.04% | - 290.24 | 1 137.14 | - 391.79% |
| 30.11.2015 | 99.86 | - 133.02 | 232.88 | - 175.08% | 700.55 | - 600.69 | -85.74% |
| 31.10.2015 | - 133.02 | 77.60 | - 210.61 | - 271.42% | - 411.53 | 278.51 | -67.68% |
| 30.09.2015 | 77.60 | 90.19 | -12.60 | -13.97% | 94.41 | -16.81 | -17.81% |
| 31.08.2015 | 90.19 | -78.85 | 169.04 | - 214.39% | 55.37 | 34.83 | 62.91% |
| 31.07.2015 | -78.85 | - 288.98 | 210.13 | -72.71% | 68.09 | - 146.94 | - 215.80% |
| 30.06.2015 | - 288.98 | 42.74 | - 331.72 | - 776.09% | 49.99 | - 338.97 | - 678.07% |
| 31.05.2015 | 42.74 | -63.41 | 106.15 | - 167.41% | 347.93 | - 305.18 | -87.71% |
| 30.04.2015 | -63.41 | 184.98 | - 248.39 | - 134.28% | 280.08 | - 343.50 | - 122.64% |
| 31.03.2015 | 184.98 | 19.78 | 165.20 | 835.12% | 72.65 | 112.33 | 154.61% |
| 28.02.2015 | 19.78 | -1 028.46 | 1 048.24 | - 101.92% | 64.03 | -44.25 | -69.11% |
| 31.01.2015 | -1 028.46 | - 290.24 | - 738.22 | 254.35% | - 324.39 | - 704.07 | 217.04% |
| 31.12.2014 | - 290.24 | 700.55 | - 990.80 | - 141.43% | 402.25 | - 692.49 | - 172.15% |
| 30.11.2014 | 700.55 | - 411.53 | 1 112.08 | - 270.23% | 219.23 | 481.32 | 219.55% |
| 31.10.2014 | - 411.53 | 94.41 | - 505.94 | - 535.90% | - 930.86 | 519.34 | -55.79% |
| 30.09.2014 | 94.41 | 55.37 | 39.04 | 70.52% | 120.39 | -25.98 | -21.58% |
| 31.08.2014 | 55.37 | 68.09 | -12.73 | -18.69% | -1 163.42 | 1 218.79 | - 104.76% |
| 31.07.2014 | 68.09 | 49.99 | 18.10 | 36.21% | 85.89 | -17.79 | -20.72% |
| 30.06.2014 | 49.99 | 347.93 | - 297.94 | -85.63% | 1 232.02 | -1 182.03 | -95.94% |
| 31.05.2014 | 347.93 | 280.08 | 67.84 | 24.22% | -28.91 | 376.83 | -1 303.60% |
| 30.04.2014 | 280.08 | 72.65 | 207.44 | 285.53% | - 220.18 | 500.26 | - 227.21% |
| 31.03.2014 | 72.65 | 64.03 | 8.62 | 13.46% | - 930.38 | 1 003.03 | - 107.81% |
| 28.02.2014 | 64.03 | - 324.39 | 388.43 | - 119.74% | - 116.60 | 180.64 | - 154.92% |
| 31.01.2014 | - 324.39 | 402.25 | - 726.64 | - 180.64% | 32.66 | - 357.05 | -1 093.27% |
| 31.12.2013 | 402.25 | 219.23 | 183.02 | 83.48% | 574.35 | - 172.10 | -29.96% |
| 30.11.2013 | 219.23 | - 930.86 | 1 150.10 | - 123.55% | 15.10 | 204.13 | 1 351.76% |
| 31.10.2013 | - 930.86 | 120.39 | -1 051.25 | - 873.22% | - 527.73 | - 403.13 | 76.39% |
| 30.09.2013 | 120.39 | -1 163.42 | 1 283.81 | - 110.35% | 138.01 | -17.62 | -12.77% |
| 31.08.2013 | -1 163.42 | 85.89 | -1 249.31 | -1 454.61% | 723.38 | -1 886.80 | - 260.83% |
| 31.07.2013 | 85.89 | 1 232.02 | -1 146.13 | -93.03% | 79.56 | 6.32 | 7.95% |
| 30.06.2013 | 1 232.02 | -28.91 | 1 260.92 | -4 362.01% | - 304.18 | 1 536.20 | - 505.03% |
| 31.05.2013 | -28.91 | - 220.18 | 191.27 | -86.87% | - 110.91 | 82.00 | -73.94% |
| 30.04.2013 | - 220.18 | - 930.38 | 710.20 | -76.33% | -64.51 | - 155.67 | 241.31% |
| 31.03.2013 | - 930.38 | - 116.60 | - 813.78 | 697.91% | 201.65 | -1 132.04 | - 561.38% |
| 28.02.2013 | - 116.60 | 32.66 | - 149.26 | - 457.03% | -66.30 | -50.31 | 75.88% |
| 31.01.2013 | 32.66 | 574.35 | - 541.69 | -94.31% | 530.18 | - 497.53 | -93.84% |
| 31.12.2012 | 574.35 | 15.10 | 559.25 | 3 703.38% | - 559.17 | 1 133.52 | - 202.71% |
| 30.11.2012 | 15.10 | - 527.73 | 542.83 | - 102.86% | - 354.25 | 369.35 | - 104.26% |
| 31.10.2012 | - 527.73 | 138.01 | - 665.74 | - 482.39% | -32.54 | - 495.19 | 1 521.74% |
| 30.09.2012 | 138.01 | 723.38 | - 585.38 | -80.92% | 151.31 | -13.31 | -8.79% |
| 31.08.2012 | 723.38 | 79.56 | 643.82 | 809.21% | 162.14 | 561.25 | 346.16% |
| 31.07.2012 | 79.56 | - 304.18 | 383.74 | - 126.16% | -98.75 | 178.31 | - 180.57% |
| 30.06.2012 | - 304.18 | - 110.91 | - 193.27 | 174.27% | 1 908.36 | -2 212.54 | - 115.94% |
| 31.05.2012 | - 110.91 | -64.51 | -46.40 | 71.92% | 88.66 | - 199.57 | - 225.09% |
| 30.04.2012 | -64.51 | 201.65 | - 266.16 | - 131.99% | 61.72 | - 126.23 | - 204.53% |
| 31.03.2012 | 201.65 | -66.30 | 267.95 | - 404.17% | 35.63 | 166.02 | 465.96% |
| 29.02.2012 | -66.30 | 530.18 | - 596.48 | - 112.50% | 8.05 | -74.35 | - 923.45% |
| 31.01.2012 | 530.18 | - 559.17 | 1 089.36 | - 194.82% | 47.49 | 482.70 | 1 016.44% |
| 31.12.2011 | - 559.17 | - 354.25 | - 204.92 | 57.85% | 117.47 | - 676.64 | - 576.00% |
| 30.11.2011 | - 354.25 | -32.54 | - 321.71 | 988.63% | -28.68 | - 325.57 | 1 135.31% |
| 31.10.2011 | -32.54 | 151.31 | - 183.85 | - 121.51% | -17.95 | -14.59 | 81.31% |
| 30.09.2011 | 151.31 | 162.14 | -10.82 | -6.68% | 16.14 | 135.17 | 837.50% |
| 31.08.2011 | 162.14 | -98.75 | 260.89 | - 264.19% | 146.96 | 15.18 | 10.33% |
| 31.07.2011 | -98.75 | 1 908.36 | -2 007.11 | - 105.17% | -1 170.87 | 1 072.12 | -91.57% |
| 30.06.2011 | 1 908.36 | 88.66 | 1 819.70 | 2 052.47% | 1 137.07 | 771.29 | 67.83% |
| 31.05.2011 | 88.66 | 61.72 | 26.94 | 43.65% | 167.29 | -78.63 | -47.00% |
| 30.04.2011 | 61.72 | 35.63 | 26.09 | 73.22% | 32.10 | 29.61 | 92.25% |
| 31.03.2011 | 35.63 | 8.05 | 27.58 | 342.55% | - 299.46 | 335.09 | - 111.90% |
| 28.02.2011 | 8.05 | 47.49 | -39.44 | -83.05% | -12.59 | 20.64 | - 163.96% |
| 31.01.2011 | 47.49 | 117.47 | -69.98 | -59.57% | 34.23 | 13.26 | 38.73% |
| 31.12.2010 | 117.47 | -28.68 | 146.15 | - 509.64% | - 191.80 | 309.27 | - 161.25% |
| 30.11.2010 | -28.68 | -17.95 | -10.73 | 59.78% | 311.73 | - 340.41 | - 109.20% |
| 31.10.2010 | -17.95 | 16.14 | -34.09 | - 211.20% | -80.96 | 63.02 | -77.83% |
| 30.09.2010 | 16.14 | 146.96 | - 130.82 | -89.02% | 26.92 | -10.78 | -40.05% |
| 31.08.2010 | 146.96 | -1 170.87 | 1 317.83 | - 112.55% | 65.15 | 81.81 | 125.58% |
| 31.07.2010 | -1 170.87 | 1 137.07 | -2 307.94 | - 202.97% | -41.13 | -1 129.74 | 2 746.95% |
| 30.06.2010 | 1 137.07 | 167.29 | 969.78 | 579.71% | -28.12 | 1 165.19 | -4 144.21% |
| 31.05.2010 | 167.29 | 32.10 | 135.18 | 421.09% | 39.48 | 127.81 | 323.77% |
| 30.04.2010 | 32.10 | - 299.46 | 331.56 | - 110.72% | 146.74 | - 114.64 | -78.12% |
| 31.03.2010 | - 299.46 | -12.59 | - 286.87 | 2 279.09% | 2.37 | - 301.82 | -12 751.29% |
| 28.02.2010 | -12.59 | 34.23 | -46.82 | - 136.77% | -4.02 | -8.57 | 213.03% |
| 31.01.2010 | 34.23 | - 191.80 | 226.03 | - 117.85% | 8.53 | 25.70 | 301.16% |
| 31.12.2009 | - 191.80 | 311.73 | - 503.53 | - 161.53% | - | - | - |
| 30.11.2009 | 311.73 | -80.96 | 392.69 | - 485.03% | - | - | - |
| 31.10.2009 | -80.96 | 26.92 | - 107.89 | - 400.71% | - | - | - |
| 30.09.2009 | 26.92 | 65.15 | -38.22 | -58.67% | - | - | - |
| 31.08.2009 | 65.15 | -41.13 | 106.27 | - 258.40% | - | - | - |
| 31.07.2009 | -41.13 | -28.12 | -13.01 | 46.28% | - | - | - |
| 30.06.2009 | -28.12 | 39.48 | -67.59 | - 171.22% | - | - | - |
| 31.05.2009 | 39.48 | 146.74 | - 107.27 | -73.10% | - | - | - |
| 30.04.2009 | 146.74 | 2.37 | 144.38 | 6 099.58% | - | - | - |
| 31.03.2009 | 2.37 | -4.02 | 6.39 | - 158.87% | - | - | - |
| 28.02.2009 | -4.02 | 8.53 | -12.55 | - 147.12% | - | - | - |
| 31.01.2009 | 8.53 | - | - | - | - | - | - |
Graf jako obrázek

Podobné sestavy
Aplikace Ekonomika ČNB ze sekce makroekonomika zobrazuje časové řady hlavních makroekonomických údajů z ekonomiky ČR. Najdete zde přes 10.000 grafů různých hodnot od úrokových sazeb, přes statistiky státního rozpočtu, statistiky ČNB a data zpracovávaná ČSÚ. Data jsou k dispozici obvykle za posledních více než 20 let, od prosince roku 1992. Zdroj dat: ČNB ARAD

