Holdings of securities other than shares issued by residents - ekonomika ČNB
Aktualizace dat Holdings of securities other than shares issued by residents v této aplikaci skončila 30.6.2023. Aktualizovná data časových řad najdete na stránkách nové aplikace z dat ARAD ČNB
Nové časové řady makroekonomiky a jejich data
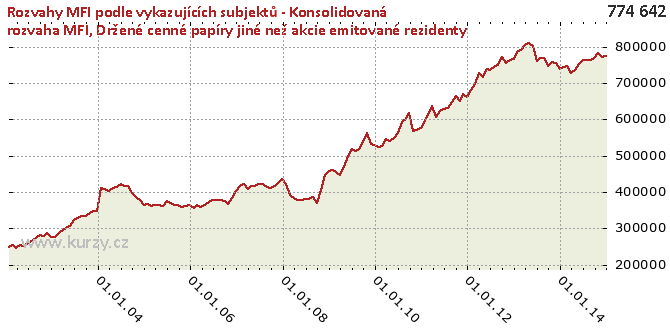
Graf hodnot, Balance sheets of MFIs by reporting institutions - Consolidated balance sheet of MFIs
Meziroční srovnání
Minima a maxima
| Typ | Období | Hodnota |
|---|---|---|
| Max | 30.04.2013 | 811 424.32 |
| Min | 31.03.2002 | 244 461.32 |
Historické hodnoty
| Období | Hodnota | Předchozí | Rozdíl | Změna | Před rokem | Rozdíl | Změna |
|---|---|---|---|---|---|---|---|
| 31.12.2014 | 774 642.98 | 771 083.52 | 3 559.46 | 0.46% | 737 439.80 | 37 203.18 | 5.04% |
| 30.11.2014 | 771 083.52 | 782 469.64 | -11 386.12 | -1.46% | 754 291.72 | 16 791.80 | 2.23% |
| 31.10.2014 | 782 469.64 | 768 730.79 | 13 738.85 | 1.79% | 758 483.57 | 23 986.07 | 3.16% |
| 30.09.2014 | 768 730.79 | 762 183.30 | 6 547.48 | 0.86% | 747 952.83 | 20 777.95 | 2.78% |
| 31.08.2014 | 762 183.30 | 762 834.15 | - 650.85 | -0.09% | 768 004.71 | -5 821.41 | -0.76% |
| 31.07.2014 | 762 834.15 | 764 251.49 | -1 417.33 | -0.19% | 768 746.81 | -5 912.66 | -0.77% |
| 30.06.2014 | 764 251.49 | 753 187.45 | 11 064.04 | 1.47% | 759 344.80 | 4 906.69 | 0.65% |
| 31.05.2014 | 753 187.45 | 736 566.25 | 16 621.20 | 2.26% | 800 757.89 | -47 570.44 | -5.94% |
| 30.04.2014 | 736 566.25 | 728 671.01 | 7 895.23 | 1.08% | 811 424.32 | -74 858.07 | -9.23% |
| 31.03.2014 | 728 671.01 | 747 494.98 | -18 823.97 | -2.52% | 805 577.30 | -76 906.29 | -9.55% |
| 28.02.2014 | 747 494.98 | 744 436.11 | 3 058.88 | 0.41% | 790 388.27 | -42 893.29 | -5.43% |
| 31.01.2014 | 744 436.11 | 737 439.80 | 6 996.31 | 0.95% | 789 469.18 | -45 033.07 | -5.70% |
| 31.12.2013 | 737 439.80 | 754 291.72 | -16 851.92 | -2.23% | 767 390.01 | -29 950.21 | -3.90% |
| 30.11.2013 | 754 291.72 | 758 483.57 | -4 191.85 | -0.55% | 762 133.92 | -7 842.20 | -1.03% |
| 31.10.2013 | 758 483.57 | 747 952.83 | 10 530.73 | 1.41% | 755 669.68 | 2 813.89 | 0.37% |
| 30.09.2013 | 747 952.83 | 768 004.71 | -20 051.88 | -2.61% | 771 021.06 | -23 068.22 | -2.99% |
| 31.08.2013 | 768 004.71 | 768 746.81 | - 742.09 | -0.10% | 749 731.49 | 18 273.23 | 2.44% |
| 31.07.2013 | 768 746.81 | 759 344.80 | 9 402.01 | 1.24% | 745 063.13 | 23 683.68 | 3.18% |
| 30.06.2013 | 759 344.80 | 800 757.89 | -41 413.10 | -5.17% | 737 024.15 | 22 320.64 | 3.03% |
| 31.05.2013 | 800 757.89 | 811 424.32 | -10 666.43 | -1.31% | 737 417.82 | 63 340.07 | 8.59% |
| 30.04.2013 | 811 424.32 | 805 577.30 | 5 847.02 | 0.73% | 716 376.52 | 95 047.80 | 13.27% |
| 31.03.2013 | 805 577.30 | 790 388.27 | 15 189.03 | 1.92% | 726 791.86 | 78 785.44 | 10.84% |
| 28.02.2013 | 790 388.27 | 789 469.18 | 919.09 | 0.12% | 698 050.10 | 92 338.17 | 13.23% |
| 31.01.2013 | 789 469.18 | 767 390.01 | 22 079.17 | 2.88% | 681 581.32 | 107 887.86 | 15.83% |
| 31.12.2012 | 767 390.01 | 762 133.92 | 5 256.09 | 0.69% | 662 795.55 | 104 594.46 | 15.78% |
| 30.11.2012 | 762 133.92 | 755 669.68 | 6 464.24 | 0.86% | 668 821.36 | 93 312.56 | 13.95% |
| 31.10.2012 | 755 669.68 | 771 021.06 | -15 351.38 | -1.99% | 649 530.37 | 106 139.31 | 16.34% |
| 30.09.2012 | 771 021.06 | 749 731.49 | 21 289.57 | 2.84% | 664 238.31 | 106 782.75 | 16.08% |
| 31.08.2012 | 749 731.49 | 745 063.13 | 4 668.36 | 0.63% | 646 975.67 | 102 755.82 | 15.88% |
| 31.07.2012 | 745 063.13 | 737 024.15 | 8 038.97 | 1.09% | 631 004.03 | 114 059.10 | 18.08% |
| 30.06.2012 | 737 024.15 | 737 417.82 | - 393.67 | -0.05% | 629 194.12 | 107 830.03 | 17.14% |
| 31.05.2012 | 737 417.82 | 716 376.52 | 21 041.30 | 2.94% | 623 732.31 | 113 685.51 | 18.23% |
| 30.04.2012 | 716 376.52 | 726 791.86 | -10 415.34 | -1.43% | 607 281.01 | 109 095.51 | 17.96% |
| 31.03.2012 | 726 791.86 | 698 050.10 | 28 741.76 | 4.12% | 636 420.40 | 90 371.47 | 14.20% |
| 29.02.2012 | 698 050.10 | 681 581.32 | 16 468.78 | 2.42% | 616 824.42 | 81 225.69 | 13.17% |
| 31.01.2012 | 681 581.32 | 662 795.55 | 18 785.77 | 2.83% | 594 288.06 | 87 293.26 | 14.69% |
| 31.12.2011 | 662 795.55 | 668 821.36 | -6 025.81 | -0.90% | 577 331.97 | 85 463.58 | 14.80% |
| 30.11.2011 | 668 821.36 | 649 530.37 | 19 290.99 | 2.97% | 571 337.10 | 97 484.25 | 17.06% |
| 31.10.2011 | 649 530.37 | 664 238.31 | -14 707.94 | -2.21% | 568 191.89 | 81 338.48 | 14.32% |
| 30.09.2011 | 664 238.31 | 646 975.67 | 17 262.64 | 2.67% | 617 240.83 | 46 997.47 | 7.61% |
| 31.08.2011 | 646 975.67 | 631 004.03 | 15 971.64 | 2.53% | 599 958.73 | 47 016.93 | 7.84% |
| 31.07.2011 | 631 004.03 | 629 194.12 | 1 809.90 | 0.29% | 592 977.45 | 38 026.57 | 6.41% |
| 30.06.2011 | 629 194.12 | 623 732.31 | 5 461.81 | 0.88% | 562 855.59 | 66 338.54 | 11.79% |
| 31.05.2011 | 623 732.31 | 607 281.01 | 16 451.31 | 2.71% | 549 198.44 | 74 533.88 | 13.57% |
| 30.04.2011 | 607 281.01 | 636 420.40 | -29 139.39 | -4.58% | 539 784.07 | 67 496.94 | 12.50% |
| 31.03.2011 | 636 420.40 | 616 824.42 | 19 595.98 | 3.18% | 546 267.38 | 90 153.02 | 16.50% |
| 28.02.2011 | 616 824.42 | 594 288.06 | 22 536.36 | 3.79% | 526 568.13 | 90 256.29 | 17.14% |
| 31.01.2011 | 594 288.06 | 577 331.97 | 16 956.08 | 2.94% | 522 803.86 | 71 484.20 | 13.67% |
| 31.12.2010 | 577 331.97 | 571 337.10 | 5 994.87 | 1.05% | 528 317.85 | 49 014.13 | 9.28% |
| 30.11.2010 | 571 337.10 | 568 191.89 | 3 145.21 | 0.55% | 531 124.64 | 40 212.47 | 7.57% |
| 31.10.2010 | 568 191.89 | 617 240.83 | -49 048.94 | -7.95% | 562 537.38 | 5 654.51 | 1.01% |
| 30.09.2010 | 617 240.83 | 599 958.73 | 17 282.10 | 2.88% | 538 890.33 | 78 350.50 | 14.54% |
| 31.08.2010 | 599 958.73 | 592 977.45 | 6 981.28 | 1.18% | 519 432.11 | 80 526.62 | 15.50% |
| 31.07.2010 | 592 977.45 | 562 855.59 | 30 121.86 | 5.35% | 512 651.61 | 80 325.84 | 15.67% |
| 30.06.2010 | 562 855.59 | 549 198.44 | 13 657.15 | 2.49% | 518 817.55 | 44 038.04 | 8.49% |
| 31.05.2010 | 549 198.44 | 539 784.07 | 9 414.37 | 1.74% | 499 879.95 | 49 318.49 | 9.87% |
| 30.04.2010 | 539 784.07 | 546 267.38 | -6 483.31 | -1.19% | 468 663.97 | 71 120.10 | 15.18% |
| 31.03.2010 | 546 267.38 | 526 568.13 | 19 699.25 | 3.74% | 447 754.51 | 98 512.87 | 22.00% |
| 28.02.2010 | 526 568.13 | 522 803.86 | 3 764.26 | 0.72% | 453 854.65 | 72 713.48 | 16.02% |
| 31.01.2010 | 522 803.86 | 528 317.85 | -5 513.98 | -1.04% | 460 819.34 | 61 984.53 | 13.45% |
| 31.12.2009 | 528 317.85 | 531 124.64 | -2 806.79 | -0.53% | 457 230.63 | 71 087.22 | 15.55% |
| 30.11.2009 | 531 124.64 | 562 537.38 | -31 412.74 | -5.58% | 445 655.28 | 85 469.36 | 19.18% |
| 31.10.2009 | 562 537.38 | 538 890.33 | 23 647.05 | 4.39% | 406 118.77 | 156 418.61 | 38.52% |
| 30.09.2009 | 538 890.33 | 519 432.11 | 19 458.22 | 3.75% | 369 442.58 | 169 447.76 | 45.87% |
| 31.08.2009 | 519 432.11 | 512 651.61 | 6 780.50 | 1.32% | 385 018.85 | 134 413.26 | 34.91% |
| 31.07.2009 | 512 651.61 | 518 817.55 | -6 165.94 | -1.19% | 381 439.45 | 131 212.16 | 34.40% |
| 30.06.2009 | 518 817.55 | 499 879.95 | 18 937.61 | 3.79% | 380 869.71 | 137 947.85 | 36.22% |
| 31.05.2009 | 499 879.95 | 468 663.97 | 31 215.98 | 6.66% | 377 512.77 | 122 367.17 | 32.41% |
| 30.04.2009 | 468 663.97 | 447 754.51 | 20 909.46 | 4.67% | 377 877.74 | 90 786.23 | 24.03% |
| 31.03.2009 | 447 754.51 | 453 854.65 | -6 100.14 | -1.34% | 381 967.32 | 65 787.18 | 17.22% |
| 28.02.2009 | 453 854.65 | 460 819.34 | -6 964.69 | -1.51% | 390 445.10 | 63 409.55 | 16.24% |
| 31.01.2009 | 460 819.34 | 457 230.63 | 3 588.71 | 0.78% | 421 406.67 | 39 412.67 | 9.35% |
| 31.12.2008 | 457 230.63 | 445 655.28 | 11 575.35 | 2.60% | 436 351.23 | 20 879.40 | 4.78% |
| 30.11.2008 | 445 655.28 | 406 118.77 | 39 536.51 | 9.74% | 424 918.65 | 20 736.63 | 4.88% |
| 31.10.2008 | 406 118.77 | 369 442.58 | 36 676.19 | 9.93% | 415 687.66 | -9 568.89 | -2.30% |
| 30.09.2008 | 369 442.58 | 385 018.85 | -15 576.28 | -4.05% | 410 001.04 | -40 558.46 | -9.89% |
| 31.08.2008 | 385 018.85 | 381 439.45 | 3 579.40 | 0.94% | 413 310.48 | -28 291.63 | -6.85% |
| 31.07.2008 | 381 439.45 | 380 869.71 | 569.74 | 0.15% | 421 554.34 | -40 114.89 | -9.52% |
| 30.06.2008 | 380 869.71 | 377 512.77 | 3 356.93 | 0.89% | 421 224.70 | -40 354.99 | -9.58% |
| 31.05.2008 | 377 512.77 | 377 877.74 | - 364.96 | -0.10% | 415 180.46 | -37 667.69 | -9.07% |
| 30.04.2008 | 377 877.74 | 381 967.32 | -4 089.58 | -1.07% | 416 849.75 | -38 972.01 | -9.35% |
| 31.03.2008 | 381 967.32 | 390 445.10 | -8 477.77 | -2.17% | 407 275.73 | -25 308.40 | -6.21% |
| 29.02.2008 | 390 445.10 | 421 406.67 | -30 961.57 | -7.35% | 423 135.73 | -32 690.63 | -7.73% |
| 31.01.2008 | 421 406.67 | 436 351.23 | -14 944.56 | -3.42% | 415 341.95 | 6 064.72 | 1.46% |
| 31.12.2007 | 436 351.23 | 424 918.65 | 11 432.58 | 2.69% | 402 604.61 | 33 746.62 | 8.38% |
| 30.11.2007 | 424 918.65 | 415 687.66 | 9 230.99 | 2.22% | 383 569.38 | 41 349.27 | 10.78% |
| 31.10.2007 | 415 687.66 | 410 001.04 | 5 686.62 | 1.39% | 366 641.77 | 49 045.89 | 13.38% |
| 30.09.2007 | 410 001.04 | 413 310.48 | -3 309.45 | -0.80% | 375 596.23 | 34 404.81 | 9.16% |
| 31.08.2007 | 413 310.48 | 421 554.34 | -8 243.85 | -1.96% | 376 526.53 | 36 783.96 | 9.77% |
| 31.07.2007 | 421 554.34 | 421 224.70 | 329.64 | 0.08% | 377 289.12 | 44 265.21 | 11.73% |
| 30.06.2007 | 421 224.70 | 415 180.46 | 6 044.24 | 1.46% | 377 209.29 | 44 015.41 | 11.67% |
| 31.05.2007 | 415 180.46 | 416 849.75 | -1 669.29 | -0.40% | 371 320.55 | 43 859.91 | 11.81% |
| 30.04.2007 | 416 849.75 | 407 275.73 | 9 574.02 | 2.35% | 364 850.82 | 51 998.93 | 14.25% |
| 31.03.2007 | 407 275.73 | 423 135.73 | -15 860.00 | -3.75% | 358 744.25 | 48 531.48 | 13.53% |
| 28.02.2007 | 423 135.73 | 415 341.95 | 7 793.78 | 1.88% | 362 723.11 | 60 412.62 | 16.66% |
| 31.01.2007 | 415 341.95 | 402 604.61 | 12 737.34 | 3.16% | 357 046.78 | 58 295.17 | 16.33% |
| 31.12.2006 | 402 604.61 | 383 569.38 | 19 035.23 | 4.96% | 364 212.66 | 38 391.95 | 10.54% |
| 30.11.2006 | 383 569.38 | 366 641.77 | 16 927.61 | 4.62% | 360 450.82 | 23 118.56 | 6.41% |
| 31.10.2006 | 366 641.77 | 375 596.23 | -8 954.46 | -2.38% | 358 599.93 | 8 041.84 | 2.24% |
| 30.09.2006 | 375 596.23 | 376 526.53 | - 930.30 | -0.25% | 363 136.15 | 12 460.08 | 3.43% |
| 31.08.2006 | 376 526.53 | 377 289.12 | - 762.60 | -0.20% | 363 880.76 | 12 645.77 | 3.48% |
| 31.07.2006 | 377 289.12 | 377 209.29 | 79.83 | 0.02% | 369 970.97 | 7 318.15 | 1.98% |
| 30.06.2006 | 377 209.29 | 371 320.55 | 5 888.75 | 1.59% | 374 596.20 | 2 613.10 | 0.70% |
| 31.05.2006 | 371 320.55 | 364 850.82 | 6 469.73 | 1.77% | 361 617.27 | 9 703.28 | 2.68% |
| 30.04.2006 | 364 850.82 | 358 744.25 | 6 106.57 | 1.70% | 363 646.10 | 1 204.71 | 0.33% |
| 31.03.2006 | 358 744.25 | 362 723.11 | -3 978.86 | -1.10% | 362 941.71 | -4 197.47 | -1.16% |
| 28.02.2006 | 362 723.11 | 357 046.78 | 5 676.33 | 1.59% | 362 344.49 | 378.62 | 0.10% |
| 31.01.2006 | 357 046.78 | 364 212.66 | -7 165.88 | -1.97% | 365 645.71 | -8 598.93 | -2.35% |
| 31.12.2005 | 364 212.66 | 360 450.82 | 3 761.84 | 1.04% | 365 077.13 | - 864.46 | -0.24% |
| 30.11.2005 | 360 450.82 | 358 599.93 | 1 850.89 | 0.52% | 377 582.12 | -17 131.30 | -4.54% |
| 31.10.2005 | 358 599.93 | 363 136.15 | -4 536.22 | -1.25% | 385 253.45 | -26 653.53 | -6.92% |
| 30.09.2005 | 363 136.15 | 363 880.76 | - 744.61 | -0.20% | 398 296.82 | -35 160.67 | -8.83% |
| 31.08.2005 | 363 880.76 | 369 970.97 | -6 090.22 | -1.65% | 415 451.99 | -51 571.24 | -12.41% |
| 31.07.2005 | 369 970.97 | 374 596.20 | -4 625.22 | -1.23% | 417 073.47 | -47 102.50 | -11.29% |
| 30.06.2005 | 374 596.20 | 361 617.27 | 12 978.93 | 3.59% | 421 714.75 | -47 118.55 | -11.17% |
| 31.05.2005 | 361 617.27 | 363 646.10 | -2 028.83 | -0.56% | 414 819.44 | -53 202.17 | -12.83% |
| 30.04.2005 | 363 646.10 | 362 941.71 | 704.39 | 0.19% | 411 399.42 | -47 753.32 | -11.61% |
| 31.03.2005 | 362 941.71 | 362 344.49 | 597.22 | 0.16% | 401 758.41 | -38 816.70 | -9.66% |
| 28.02.2005 | 362 344.49 | 365 645.71 | -3 301.22 | -0.90% | 407 960.70 | -45 616.20 | -11.18% |
| 31.01.2005 | 365 645.71 | 365 077.13 | 568.58 | 0.16% | 409 543.95 | -43 898.24 | -10.72% |
| 31.12.2004 | 365 077.13 | 377 582.12 | -12 504.99 | -3.31% | 348 566.83 | 16 510.30 | 4.74% |
| 30.11.2004 | 377 582.12 | 385 253.45 | -7 671.33 | -1.99% | 346 346.89 | 31 235.23 | 9.02% |
| 31.10.2004 | 385 253.45 | 398 296.82 | -13 043.36 | -3.27% | 343 050.78 | 42 202.68 | 12.30% |
| 30.09.2004 | 398 296.82 | 415 451.99 | -17 155.18 | -4.13% | 334 549.76 | 63 747.05 | 19.05% |
| 31.08.2004 | 415 451.99 | 417 073.47 | -1 621.47 | -0.39% | 334 072.35 | 81 379.65 | 24.36% |
| 31.07.2004 | 417 073.47 | 421 714.75 | -4 641.28 | -1.10% | 328 554.59 | 88 518.88 | 26.94% |
| 30.06.2004 | 421 714.75 | 414 819.44 | 6 895.31 | 1.66% | 322 244.31 | 99 470.44 | 30.87% |
| 31.05.2004 | 414 819.44 | 411 399.42 | 3 420.01 | 0.83% | 306 433.38 | 108 386.06 | 35.37% |
| 30.04.2004 | 411 399.42 | 401 758.41 | 9 641.01 | 2.40% | 300 545.35 | 110 854.08 | 36.88% |
| 31.03.2004 | 401 758.41 | 407 960.70 | -6 202.28 | -1.52% | 294 997.27 | 106 761.14 | 36.19% |
| 29.02.2004 | 407 960.70 | 409 543.95 | -1 583.25 | -0.39% | 287 228.49 | 120 732.20 | 42.03% |
| 31.01.2004 | 409 543.95 | 348 566.83 | 60 977.12 | 17.49% | 275 966.58 | 133 577.36 | 48.40% |
| 31.12.2003 | 348 566.83 | 346 346.89 | 2 219.94 | 0.64% | 276 415.55 | 72 151.28 | 26.10% |
| 30.11.2003 | 346 346.89 | 343 050.78 | 3 296.11 | 0.96% | 286 433.50 | 59 913.39 | 20.92% |
| 31.10.2003 | 343 050.78 | 334 549.76 | 8 501.01 | 2.54% | 279 306.98 | 63 743.80 | 22.82% |
| 30.09.2003 | 334 549.76 | 334 072.35 | 477.41 | 0.14% | 281 431.73 | 53 118.03 | 18.87% |
| 31.08.2003 | 334 072.35 | 328 554.59 | 5 517.76 | 1.68% | 273 666.91 | 60 405.43 | 22.07% |
| 31.07.2003 | 328 554.59 | 322 244.31 | 6 310.28 | 1.96% | 263 617.94 | 64 936.65 | 24.63% |
| 30.06.2003 | 322 244.31 | 306 433.38 | 15 810.92 | 5.16% | 259 769.94 | 62 474.36 | 24.05% |
| 31.05.2003 | 306 433.38 | 300 545.35 | 5 888.04 | 1.96% | 251 469.47 | 54 963.91 | 21.86% |
| 30.04.2003 | 300 545.35 | 294 997.27 | 5 548.07 | 1.88% | 252 720.68 | 47 824.66 | 18.92% |
| 31.03.2003 | 294 997.27 | 287 228.49 | 7 768.78 | 2.70% | 244 461.32 | 50 535.96 | 20.67% |
| 28.02.2003 | 287 228.49 | 275 966.58 | 11 261.91 | 4.08% | 254 132.18 | 33 096.31 | 13.02% |
| 31.01.2003 | 275 966.58 | 276 415.55 | - 448.97 | -0.16% | 249 515.66 | 26 450.93 | 10.60% |
| 31.12.2002 | 276 415.55 | 286 433.50 | -10 017.94 | -3.50% | - | - | - |
| 30.11.2002 | 286 433.50 | 279 306.98 | 7 126.52 | 2.55% | - | - | - |
| 31.10.2002 | 279 306.98 | 281 431.73 | -2 124.76 | -0.75% | - | - | - |
| 30.09.2002 | 281 431.73 | 273 666.91 | 7 764.82 | 2.84% | - | - | - |
| 31.08.2002 | 273 666.91 | 263 617.94 | 10 048.97 | 3.81% | - | - | - |
| 31.07.2002 | 263 617.94 | 259 769.94 | 3 848.00 | 1.48% | - | - | - |
| 30.06.2002 | 259 769.94 | 251 469.47 | 8 300.47 | 3.30% | - | - | - |
| 31.05.2002 | 251 469.47 | 252 720.68 | -1 251.21 | -0.49% | - | - | - |
| 30.04.2002 | 252 720.68 | 244 461.32 | 8 259.37 | 3.38% | - | - | - |
| 31.03.2002 | 244 461.32 | 254 132.18 | -9 670.87 | -3.81% | - | - | - |
| 28.02.2002 | 254 132.18 | 249 515.66 | 4 616.53 | 1.85% | - | - | - |
| 31.01.2002 | 249 515.66 | - | - | - | - | - | - |
Graf jako obrázek

Podobné sestavy
Aplikace Ekonomika ČNB ze sekce makroekonomika zobrazuje časové řady hlavních makroekonomických údajů z ekonomiky ČR. Najdete zde přes 10.000 grafů různých hodnot od úrokových sazeb, přes statistiky státního rozpočtu, statistiky ČNB a data zpracovávaná ČSÚ. Data jsou k dispozici obvykle za posledních více než 20 let, od prosince roku 1992. Zdroj dat: ČNB ARAD

