Holdings of securities other than shares issued by residents - General government - ekonomika ČNB
Aktualizace dat Holdings of securities other than shares issued by residents - General government v této aplikaci skončila 30.6.2023. Aktualizovná data časových řad najdete na stránkách nové aplikace z dat ARAD ČNB
Nové časové řady makroekonomiky a jejich data
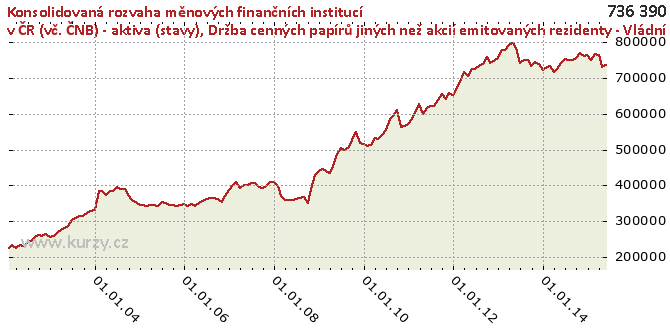
Graf hodnot, Consolidated balance sheet of the Czech MFIs (including the CNB) - assets (levels)
Meziroční srovnání
Minima a maxima
| Typ | Období | Hodnota |
|---|---|---|
| Max | 30.04.2013 | 797 560.80 |
| Min | 31.03.2002 | 224 917.20 |
Historické hodnoty
| Období | Hodnota | Předchozí | Rozdíl | Změna | Před rokem | Rozdíl | Změna |
|---|---|---|---|---|---|---|---|
| 31.05.2015 | 736 390.90 | 729 183.70 | 7 207.20 | 0.99% | 741 417.60 | -5 026.70 | -0.68% |
| 30.04.2015 | 729 183.70 | 761 804.20 | -32 620.50 | -4.28% | 723 770.10 | 5 413.60 | 0.75% |
| 31.03.2015 | 761 804.20 | 765 244.70 | -3 440.50 | -0.45% | 714 840.90 | 46 963.30 | 6.57% |
| 28.02.2015 | 765 244.70 | 748 554.20 | 16 690.50 | 2.23% | 733 782.70 | 31 462.00 | 4.29% |
| 31.01.2015 | 748 554.20 | 761 900.70 | -13 346.50 | -1.75% | 728 862.20 | 19 692.00 | 2.70% |
| 31.12.2014 | 761 900.70 | 759 190.90 | 2 709.80 | 0.36% | 721 836.80 | 40 063.90 | 5.55% |
| 30.11.2014 | 759 190.90 | 769 482.30 | -10 291.40 | -1.34% | 738 196.50 | 20 994.40 | 2.84% |
| 31.10.2014 | 769 482.30 | 755 762.40 | 13 719.90 | 1.82% | 744 079.30 | 25 403.00 | 3.41% |
| 30.09.2014 | 755 762.40 | 748 814.70 | 6 947.70 | 0.93% | 731 394.90 | 24 367.50 | 3.33% |
| 31.08.2014 | 748 814.70 | 749 101.10 | - 286.40 | -0.04% | 749 160.00 | - 345.30 | -0.05% |
| 31.07.2014 | 749 101.10 | 753 269.60 | -4 168.50 | -0.55% | 749 182.70 | -81.60 | -0.01% |
| 30.06.2014 | 753 269.60 | 741 417.60 | 11 852.00 | 1.60% | 741 467.10 | 11 802.50 | 1.59% |
| 31.05.2014 | 741 417.60 | 723 770.10 | 17 647.50 | 2.44% | 783 785.10 | -42 367.50 | -5.41% |
| 30.04.2014 | 723 770.10 | 714 840.90 | 8 929.20 | 1.25% | 797 560.80 | -73 790.70 | -9.25% |
| 31.03.2014 | 714 840.90 | 733 782.70 | -18 941.80 | -2.58% | 792 030.00 | -77 189.10 | -9.75% |
| 28.02.2014 | 733 782.70 | 728 862.20 | 4 920.50 | 0.68% | 776 769.60 | -42 986.90 | -5.53% |
| 31.01.2014 | 728 862.20 | 721 836.80 | 7 025.40 | 0.97% | 775 923.50 | -47 061.30 | -6.07% |
| 31.12.2013 | 721 836.80 | 738 196.50 | -16 359.70 | -2.22% | 754 005.40 | -32 168.60 | -4.27% |
| 30.11.2013 | 738 196.50 | 744 079.30 | -5 882.80 | -0.79% | 745 318.60 | -7 122.10 | -0.96% |
| 31.10.2013 | 744 079.30 | 731 394.90 | 12 684.40 | 1.73% | 739 673.10 | 4 406.20 | 0.60% |
| 30.09.2013 | 731 394.90 | 749 160.00 | -17 765.10 | -2.37% | 758 446.80 | -27 051.90 | -3.57% |
| 31.08.2013 | 749 160.00 | 749 182.70 | -22.70 | -0.00% | 737 149.40 | 12 010.60 | 1.63% |
| 31.07.2013 | 749 182.70 | 741 467.10 | 7 715.60 | 1.04% | 732 043.90 | 17 138.80 | 2.34% |
| 30.06.2013 | 741 467.10 | 783 785.10 | -42 318.00 | -5.40% | 724 255.80 | 17 211.30 | 2.38% |
| 31.05.2013 | 783 785.10 | 797 560.80 | -13 775.70 | -1.73% | 724 681.00 | 59 104.10 | 8.16% |
| 30.04.2013 | 797 560.80 | 792 030.00 | 5 530.80 | 0.70% | 704 212.50 | 93 348.30 | 13.26% |
| 31.03.2013 | 792 030.00 | 776 769.60 | 15 260.40 | 1.96% | 716 289.40 | 75 740.60 | 10.57% |
| 28.02.2013 | 776 769.60 | 775 923.50 | 846.10 | 0.11% | 687 605.50 | 89 164.10 | 12.97% |
| 31.01.2013 | 775 923.50 | 754 005.40 | 21 918.10 | 2.91% | 670 912.50 | 105 011.00 | 15.65% |
| 31.12.2012 | 754 005.40 | 745 318.60 | 8 686.80 | 1.17% | 651 240.10 | 102 765.30 | 15.78% |
| 30.11.2012 | 745 318.60 | 739 673.10 | 5 645.50 | 0.76% | 657 940.50 | 87 378.10 | 13.28% |
| 31.10.2012 | 739 673.10 | 758 446.80 | -18 773.70 | -2.48% | 639 287.50 | 100 385.60 | 15.70% |
| 30.09.2012 | 758 446.80 | 737 149.40 | 21 297.40 | 2.89% | 654 056.00 | 104 390.80 | 15.96% |
| 31.08.2012 | 737 149.40 | 732 043.90 | 5 105.50 | 0.70% | 637 856.00 | 99 293.40 | 15.57% |
| 31.07.2012 | 732 043.90 | 724 255.80 | 7 788.10 | 1.08% | 622 411.70 | 109 632.20 | 17.61% |
| 30.06.2012 | 724 255.80 | 724 681.00 | - 425.20 | -0.06% | 620 525.40 | 103 730.40 | 16.72% |
| 31.05.2012 | 724 681.00 | 704 212.50 | 20 468.50 | 2.91% | 616 141.30 | 108 539.70 | 17.62% |
| 30.04.2012 | 704 212.50 | 716 289.40 | -12 076.90 | -1.69% | 598 098.40 | 106 114.10 | 17.74% |
| 31.03.2012 | 716 289.40 | 687 605.50 | 28 683.90 | 4.17% | 626 102.50 | 90 186.90 | 14.40% |
| 29.02.2012 | 687 605.50 | 670 912.50 | 16 693.00 | 2.49% | 608 039.30 | 79 566.20 | 13.09% |
| 31.01.2012 | 670 912.50 | 651 240.10 | 19 672.40 | 3.02% | 586 134.60 | 84 777.90 | 14.46% |
| 31.12.2011 | 651 240.10 | 657 940.50 | -6 700.40 | -1.02% | 569 899.00 | 81 341.10 | 14.27% |
| 30.11.2011 | 657 940.50 | 639 287.50 | 18 653.00 | 2.92% | 564 760.10 | 93 180.40 | 16.50% |
| 31.10.2011 | 639 287.50 | 654 056.00 | -14 768.50 | -2.26% | 562 118.20 | 77 169.30 | 13.73% |
| 30.09.2011 | 654 056.00 | 637 856.00 | 16 200.00 | 2.54% | 610 713.90 | 43 342.10 | 7.10% |
| 31.08.2011 | 637 856.00 | 622 411.70 | 15 444.30 | 2.48% | 593 457.50 | 44 398.50 | 7.48% |
| 31.07.2011 | 622 411.70 | 620 525.40 | 1 886.30 | 0.30% | 583 689.30 | 38 722.40 | 6.63% |
| 30.06.2011 | 620 525.40 | 616 141.30 | 4 384.10 | 0.71% | 553 759.40 | 66 766.00 | 12.06% |
| 31.05.2011 | 616 141.30 | 598 098.40 | 18 042.90 | 3.02% | 539 885.30 | 76 256.00 | 14.12% |
| 30.04.2011 | 598 098.40 | 626 102.50 | -28 004.10 | -4.47% | 530 545.90 | 67 552.50 | 12.73% |
| 31.03.2011 | 626 102.50 | 608 039.30 | 18 063.20 | 2.97% | 533 269.80 | 92 832.70 | 17.41% |
| 28.02.2011 | 608 039.30 | 586 134.60 | 21 904.70 | 3.74% | 513 592.90 | 94 446.40 | 18.39% |
| 31.01.2011 | 586 134.60 | 569 899.00 | 16 235.60 | 2.85% | 509 632.80 | 76 501.80 | 15.01% |
| 31.12.2010 | 569 899.00 | 564 760.10 | 5 138.90 | 0.91% | 514 170.40 | 55 728.60 | 10.84% |
| 30.11.2010 | 564 760.10 | 562 118.20 | 2 641.90 | 0.47% | 519 240.50 | 45 519.60 | 8.77% |
| 31.10.2010 | 562 118.20 | 610 713.90 | -48 595.70 | -7.96% | 549 401.50 | 12 716.70 | 2.31% |
| 30.09.2010 | 610 713.90 | 593 457.50 | 17 256.40 | 2.91% | 525 961.30 | 84 752.60 | 16.11% |
| 31.08.2010 | 593 457.50 | 583 689.30 | 9 768.20 | 1.67% | 506 380.60 | 87 076.90 | 17.20% |
| 31.07.2010 | 583 689.30 | 553 759.40 | 29 929.90 | 5.40% | 499 910.40 | 83 778.90 | 16.76% |
| 30.06.2010 | 553 759.40 | 539 885.30 | 13 874.10 | 2.57% | 505 293.10 | 48 466.30 | 9.59% |
| 31.05.2010 | 539 885.30 | 530 545.90 | 9 339.40 | 1.76% | 486 588.20 | 53 297.10 | 10.95% |
| 30.04.2010 | 530 545.90 | 533 269.80 | -2 723.90 | -0.51% | 455 526.10 | 75 019.80 | 16.47% |
| 31.03.2010 | 533 269.80 | 513 592.90 | 19 676.90 | 3.83% | 433 740.60 | 99 529.20 | 22.95% |
| 28.02.2010 | 513 592.90 | 509 632.80 | 3 960.10 | 0.78% | 439 148.80 | 74 444.10 | 16.95% |
| 31.01.2010 | 509 632.80 | 514 170.40 | -4 537.60 | -0.88% | 445 756.90 | 63 875.90 | 14.33% |
| 31.12.2009 | 514 170.40 | 519 240.50 | -5 070.10 | -0.98% | 441 595.30 | 72 575.10 | 16.43% |
| 30.11.2009 | 519 240.50 | 549 401.50 | -30 161.00 | -5.49% | 430 465.10 | 88 775.40 | 20.62% |
| 31.10.2009 | 549 401.50 | 525 961.30 | 23 440.20 | 4.46% | 389 916.30 | 159 485.20 | 40.90% |
| 30.09.2009 | 525 961.30 | 506 380.60 | 19 580.70 | 3.87% | 352 556.60 | 173 404.70 | 49.18% |
| 31.08.2009 | 506 380.60 | 499 910.40 | 6 470.20 | 1.29% | 367 970.50 | 138 410.10 | 37.61% |
| 31.07.2009 | 499 910.40 | 505 293.10 | -5 382.70 | -1.07% | 364 218.60 | 135 691.80 | 37.26% |
| 30.06.2009 | 505 293.10 | 486 588.20 | 18 704.90 | 3.84% | 361 887.00 | 143 406.10 | 39.63% |
| 31.05.2009 | 486 588.20 | 455 526.10 | 31 062.10 | 6.82% | 358 610.50 | 127 977.70 | 35.69% |
| 30.04.2009 | 455 526.10 | 433 740.60 | 21 785.50 | 5.02% | 358 901.40 | 96 624.70 | 26.92% |
| 31.03.2009 | 433 740.60 | 439 148.80 | -5 408.20 | -1.23% | 360 978.00 | 72 762.60 | 20.16% |
| 28.02.2009 | 439 148.80 | 445 756.90 | -6 608.10 | -1.48% | 370 034.60 | 69 114.20 | 18.68% |
| 31.01.2009 | 445 756.90 | 441 595.30 | 4 161.60 | 0.94% | 399 725.70 | 46 031.20 | 11.52% |
| 31.12.2008 | 441 595.30 | 430 465.10 | 11 130.20 | 2.59% | 409 786.60 | 31 808.70 | 7.76% |
| 30.11.2008 | 430 465.10 | 389 916.30 | 40 548.80 | 10.40% | 408 807.50 | 21 657.60 | 5.30% |
| 31.10.2008 | 389 916.30 | 352 556.60 | 37 359.70 | 10.60% | 398 387.30 | -8 471.00 | -2.13% |
| 30.09.2008 | 352 556.60 | 367 970.50 | -15 413.90 | -4.19% | 392 124.60 | -39 568.00 | -10.09% |
| 31.08.2008 | 367 970.50 | 364 218.60 | 3 751.90 | 1.03% | 395 285.80 | -27 315.30 | -6.91% |
| 31.07.2008 | 364 218.60 | 361 887.00 | 2 331.60 | 0.64% | 406 259.00 | -42 040.40 | -10.35% |
| 30.06.2008 | 361 887.00 | 358 610.50 | 3 276.50 | 0.91% | 405 979.60 | -44 092.60 | -10.86% |
| 31.05.2008 | 358 610.50 | 358 901.40 | - 290.90 | -0.08% | 400 502.50 | -41 892.00 | -10.46% |
| 30.04.2008 | 358 901.40 | 360 978.00 | -2 076.60 | -0.58% | 402 060.40 | -43 159.00 | -10.73% |
| 31.03.2008 | 360 978.00 | 370 034.60 | -9 056.60 | -2.45% | 392 466.60 | -31 488.60 | -8.02% |
| 29.02.2008 | 370 034.60 | 399 725.70 | -29 691.10 | -7.43% | 409 095.30 | -39 060.70 | -9.55% |
| 31.01.2008 | 399 725.70 | 409 786.60 | -10 060.90 | -2.46% | 401 464.30 | -1 738.60 | -0.43% |
| 31.12.2007 | 409 786.60 | 408 807.50 | 979.10 | 0.24% | 388 585.90 | 21 200.70 | 5.46% |
| 30.11.2007 | 408 807.50 | 398 387.30 | 10 420.20 | 2.62% | 371 445.60 | 37 361.90 | 10.06% |
| 31.10.2007 | 398 387.30 | 392 124.60 | 6 262.70 | 1.60% | 353 986.20 | 44 401.10 | 12.54% |
| 30.09.2007 | 392 124.60 | 395 285.80 | -3 161.20 | -0.80% | 363 679.30 | 28 445.30 | 7.82% |
| 31.08.2007 | 395 285.80 | 406 259.00 | -10 973.20 | -2.70% | 364 240.40 | 31 045.40 | 8.52% |
| 31.07.2007 | 406 259.00 | 405 979.60 | 279.40 | 0.07% | 364 659.90 | 41 599.10 | 11.41% |
| 30.06.2007 | 405 979.60 | 400 502.50 | 5 477.10 | 1.37% | 363 449.00 | 42 530.60 | 11.70% |
| 31.05.2007 | 400 502.50 | 402 060.40 | -1 557.90 | -0.39% | 357 485.70 | 43 016.80 | 12.03% |
| 30.04.2007 | 402 060.40 | 392 466.60 | 9 593.80 | 2.44% | 349 975.50 | 52 084.90 | 14.88% |
| 31.03.2007 | 392 466.60 | 409 095.30 | -16 628.70 | -4.06% | 343 961.40 | 48 505.20 | 14.10% |
| 28.02.2007 | 409 095.30 | 401 464.30 | 7 631.00 | 1.90% | 348 229.10 | 60 866.20 | 17.48% |
| 31.01.2007 | 401 464.30 | 388 585.90 | 12 878.40 | 3.31% | 342 496.40 | 58 967.90 | 17.22% |
| 31.12.2006 | 388 585.90 | 371 445.60 | 17 140.30 | 4.61% | 349 812.50 | 38 773.40 | 11.08% |
| 30.11.2006 | 371 445.60 | 353 986.20 | 17 459.40 | 4.93% | 345 702.40 | 25 743.20 | 7.45% |
| 31.10.2006 | 353 986.20 | 363 679.30 | -9 693.10 | -2.67% | 341 851.10 | 12 135.10 | 3.55% |
| 30.09.2006 | 363 679.30 | 364 240.40 | - 561.10 | -0.15% | 345 013.20 | 18 666.10 | 5.41% |
| 31.08.2006 | 364 240.40 | 364 659.90 | - 419.50 | -0.12% | 344 836.40 | 19 404.00 | 5.63% |
| 31.07.2006 | 364 659.90 | 363 449.00 | 1 210.90 | 0.33% | 350 933.90 | 13 726.00 | 3.91% |
| 30.06.2006 | 363 449.00 | 357 485.70 | 5 963.30 | 1.67% | 354 401.20 | 9 047.80 | 2.55% |
| 31.05.2006 | 357 485.70 | 349 975.50 | 7 510.20 | 2.15% | 342 870.80 | 14 614.90 | 4.26% |
| 30.04.2006 | 349 975.50 | 343 961.40 | 6 014.10 | 1.75% | 345 191.10 | 4 784.40 | 1.39% |
| 31.03.2006 | 343 961.40 | 348 229.10 | -4 267.70 | -1.23% | 344 469.50 | - 508.10 | -0.15% |
| 28.02.2006 | 348 229.10 | 342 496.40 | 5 732.70 | 1.67% | 343 468.60 | 4 760.50 | 1.39% |
| 31.01.2006 | 342 496.40 | 349 812.50 | -7 316.10 | -2.09% | 347 093.20 | -4 596.80 | -1.32% |
| 31.12.2005 | 349 812.50 | 345 702.40 | 4 110.10 | 1.19% | 346 234.70 | 3 577.80 | 1.03% |
| 30.11.2005 | 345 702.40 | 341 851.10 | 3 851.30 | 1.13% | 354 783.00 | -9 080.60 | -2.56% |
| 31.10.2005 | 341 851.10 | 345 013.20 | -3 162.10 | -0.92% | 359 733.10 | -17 882.00 | -4.97% |
| 30.09.2005 | 345 013.20 | 344 836.40 | 176.80 | 0.05% | 372 738.00 | -27 724.80 | -7.44% |
| 31.08.2005 | 344 836.40 | 350 933.90 | -6 097.50 | -1.74% | 389 751.30 | -44 914.90 | -11.52% |
| 31.07.2005 | 350 933.90 | 354 401.20 | -3 467.30 | -0.98% | 391 521.00 | -40 587.10 | -10.37% |
| 30.06.2005 | 354 401.20 | 342 870.80 | 11 530.40 | 3.36% | 396 054.50 | -41 653.30 | -10.52% |
| 31.05.2005 | 342 870.80 | 345 191.10 | -2 320.30 | -0.67% | 385 489.50 | -42 618.70 | -11.06% |
| 30.04.2005 | 345 191.10 | 344 469.50 | 721.60 | 0.21% | 384 289.40 | -39 098.30 | -10.17% |
| 31.03.2005 | 344 469.50 | 343 468.60 | 1 000.90 | 0.29% | 374 605.90 | -30 136.40 | -8.04% |
| 28.02.2005 | 343 468.60 | 347 093.20 | -3 624.60 | -1.04% | 385 076.90 | -41 608.30 | -10.81% |
| 31.01.2005 | 347 093.20 | 346 234.70 | 858.50 | 0.25% | 385 767.70 | -38 674.50 | -10.03% |
| 31.12.2004 | 346 234.70 | 354 783.00 | -8 548.30 | -2.41% | 331 927.50 | 14 307.20 | 4.31% |
| 30.11.2004 | 354 783.00 | 359 733.10 | -4 950.10 | -1.38% | 328 964.10 | 25 818.90 | 7.85% |
| 31.10.2004 | 359 733.10 | 372 738.00 | -13 004.90 | -3.49% | 324 462.70 | 35 270.40 | 10.87% |
| 30.09.2004 | 372 738.00 | 389 751.30 | -17 013.30 | -4.37% | 315 896.30 | 56 841.70 | 17.99% |
| 31.08.2004 | 389 751.30 | 391 521.00 | -1 769.70 | -0.45% | 314 991.50 | 74 759.80 | 23.73% |
| 31.07.2004 | 391 521.00 | 396 054.50 | -4 533.50 | -1.14% | 308 534.30 | 82 986.70 | 26.90% |
| 30.06.2004 | 396 054.50 | 385 489.50 | 10 565.00 | 2.74% | 303 792.80 | 92 261.70 | 30.37% |
| 31.05.2004 | 385 489.50 | 384 289.40 | 1 200.10 | 0.31% | 288 670.40 | 96 819.10 | 33.54% |
| 30.04.2004 | 384 289.40 | 374 605.90 | 9 683.50 | 2.58% | 280 819.70 | 103 469.70 | 36.85% |
| 31.03.2004 | 374 605.90 | 385 076.90 | -10 471.00 | -2.72% | 275 381.50 | 99 224.40 | 36.03% |
| 29.02.2004 | 385 076.90 | 385 767.70 | - 690.80 | -0.18% | 266 552.60 | 118 524.30 | 44.47% |
| 31.01.2004 | 385 767.70 | 331 927.50 | 53 840.20 | 16.22% | 258 129.00 | 127 638.70 | 49.45% |
| 31.12.2003 | 331 927.50 | 328 964.10 | 2 963.40 | 0.90% | 257 872.90 | 74 054.60 | 28.72% |
| 30.11.2003 | 328 964.10 | 324 462.70 | 4 501.40 | 1.39% | 265 880.90 | 63 083.20 | 23.73% |
| 31.10.2003 | 324 462.70 | 315 896.30 | 8 566.40 | 2.71% | 260 785.20 | 63 677.50 | 24.42% |
| 30.09.2003 | 315 896.30 | 314 991.50 | 904.80 | 0.29% | 262 736.10 | 53 160.20 | 20.23% |
| 31.08.2003 | 314 991.50 | 308 534.30 | 6 457.20 | 2.09% | 256 294.80 | 58 696.70 | 22.90% |
| 31.07.2003 | 308 534.30 | 303 792.80 | 4 741.50 | 1.56% | 245 957.80 | 62 576.50 | 25.44% |
| 30.06.2003 | 303 792.80 | 288 670.40 | 15 122.40 | 5.24% | 241 037.80 | 62 755.00 | 26.04% |
| 31.05.2003 | 288 670.40 | 280 819.70 | 7 850.70 | 2.80% | 232 219.10 | 56 451.30 | 24.31% |
| 30.04.2003 | 280 819.70 | 275 381.50 | 5 438.20 | 1.97% | 233 580.90 | 47 238.80 | 20.22% |
| 31.03.2003 | 275 381.50 | 266 552.60 | 8 828.90 | 3.31% | 224 917.20 | 50 464.30 | 22.44% |
| 28.02.2003 | 266 552.60 | 258 129.00 | 8 423.60 | 3.26% | 233 501.50 | 33 051.10 | 14.15% |
| 31.01.2003 | 258 129.00 | 257 872.90 | 256.10 | 0.10% | 225 312.60 | 32 816.40 | 14.56% |
| 31.12.2002 | 257 872.90 | 265 880.90 | -8 008.00 | -3.01% | - | - | - |
| 30.11.2002 | 265 880.90 | 260 785.20 | 5 095.70 | 1.95% | - | - | - |
| 31.10.2002 | 260 785.20 | 262 736.10 | -1 950.90 | -0.74% | - | - | - |
| 30.09.2002 | 262 736.10 | 256 294.80 | 6 441.30 | 2.51% | - | - | - |
| 31.08.2002 | 256 294.80 | 245 957.80 | 10 337.00 | 4.20% | - | - | - |
| 31.07.2002 | 245 957.80 | 241 037.80 | 4 920.00 | 2.04% | - | - | - |
| 30.06.2002 | 241 037.80 | 232 219.10 | 8 818.70 | 3.80% | - | - | - |
| 31.05.2002 | 232 219.10 | 233 580.90 | -1 361.80 | -0.58% | - | - | - |
| 30.04.2002 | 233 580.90 | 224 917.20 | 8 663.70 | 3.85% | - | - | - |
| 31.03.2002 | 224 917.20 | 233 501.50 | -8 584.30 | -3.68% | - | - | - |
| 28.02.2002 | 233 501.50 | 225 312.60 | 8 188.90 | 3.63% | - | - | - |
| 31.01.2002 | 225 312.60 | - | - | - | - | - | - |
Graf jako obrázek

Podobné sestavy
Aplikace Ekonomika ČNB ze sekce makroekonomika zobrazuje časové řady hlavních makroekonomických údajů z ekonomiky ČR. Najdete zde přes 10.000 grafů různých hodnot od úrokových sazeb, přes statistiky státního rozpočtu, statistiky ČNB a data zpracovávaná ČSÚ. Data jsou k dispozici obvykle za posledních více než 20 let, od prosince roku 1992. Zdroj dat: ČNB ARAD

