Other assets (Levels»Equity funds balance sheet) - ekonomika ČNB
Aktualizace dat Other assets (Levels»Equity funds balance sheet) v této aplikaci skončila 30.6.2023. Aktualizovná data časových řad najdete na stránkách nové aplikace z dat ARAD ČNB
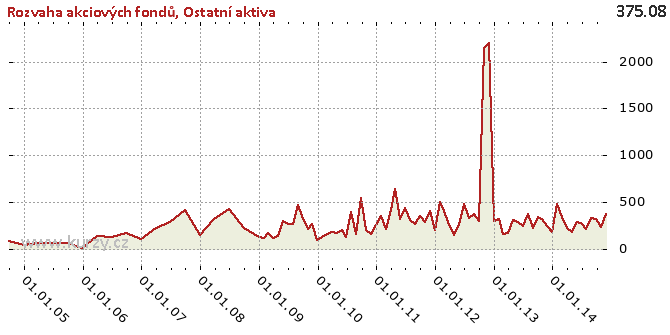
Graf hodnot, Equity funds balance sheet
Meziroční srovnání
Minima a maxima
| Typ | Období | Hodnota |
|---|---|---|
| Max | 30.11.2012 | 2 203.48 |
| Min | 31.12.2005 | 6.56 |
Historické hodnoty
| Období | Hodnota | Předchozí | Rozdíl | Změna | Před rokem | Rozdíl | Změna |
|---|---|---|---|---|---|---|---|
| 30.11.2014 | 375.08 | 236.91 | 138.18 | 58.32% | 250.24 | 124.84 | 49.89% |
| 31.10.2014 | 236.91 | 324.01 | -87.10 | -26.88% | 321.94 | -85.03 | -26.41% |
| 30.09.2014 | 324.01 | 329.91 | -5.90 | -1.79% | 345.67 | -21.66 | -6.27% |
| 31.08.2014 | 329.91 | 217.81 | 112.10 | 51.47% | 222.23 | 107.68 | 48.45% |
| 31.07.2014 | 217.81 | 277.35 | -59.54 | -21.47% | 373.70 | - 155.90 | -41.72% |
| 30.06.2014 | 277.35 | 284.22 | -6.87 | -2.42% | 244.41 | 32.93 | 13.47% |
| 31.05.2014 | 284.22 | 184.10 | 100.12 | 54.38% | 288.39 | -4.17 | -1.45% |
| 30.04.2014 | 184.10 | 229.25 | -45.15 | -19.69% | 304.81 | - 120.71 | -39.60% |
| 31.03.2014 | 229.25 | 338.13 | - 108.88 | -32.20% | 176.26 | 52.98 | 30.06% |
| 28.02.2014 | 338.13 | 485.46 | - 147.33 | -30.35% | 155.54 | 182.59 | 117.39% |
| 31.01.2014 | 485.46 | 186.96 | 298.51 | 159.67% | 315.30 | 170.16 | 53.97% |
| 31.12.2013 | 186.96 | 250.24 | -63.28 | -25.29% | 294.51 | - 107.56 | -36.52% |
| 30.11.2013 | 250.24 | 321.94 | -71.70 | -22.27% | 2 203.48 | -1 953.24 | -88.64% |
| 31.10.2013 | 321.94 | 345.67 | -23.73 | -6.86% | 2 142.26 | -1 820.32 | -84.97% |
| 30.09.2013 | 345.67 | 222.23 | 123.44 | 55.55% | 300.33 | 45.34 | 15.10% |
| 31.08.2013 | 222.23 | 373.70 | - 151.48 | -40.53% | 372.12 | - 149.89 | -40.28% |
| 31.07.2013 | 373.70 | 244.41 | 129.29 | 52.90% | 330.27 | 43.43 | 13.15% |
| 30.06.2013 | 244.41 | 288.39 | -43.97 | -15.25% | 481.32 | - 236.91 | -49.22% |
| 31.05.2013 | 288.39 | 304.81 | -16.43 | -5.39% | 255.01 | 33.37 | 13.09% |
| 30.04.2013 | 304.81 | 176.26 | 128.55 | 72.93% | 153.37 | 151.44 | 98.75% |
| 31.03.2013 | 176.26 | 155.54 | 20.73 | 13.32% | 259.75 | -83.49 | -32.14% |
| 28.02.2013 | 155.54 | 315.30 | - 159.76 | -50.67% | 403.67 | - 248.13 | -61.47% |
| 31.01.2013 | 315.30 | 294.51 | 20.79 | 7.06% | 497.06 | - 181.77 | -36.57% |
| 31.12.2012 | 294.51 | 2 203.48 | -1 908.97 | -86.63% | 202.65 | 91.86 | 45.33% |
| 30.11.2012 | 2 203.48 | 2 142.26 | 61.22 | 2.86% | 410.74 | 1 792.74 | 436.47% |
| 31.10.2012 | 2 142.26 | 300.33 | 1 841.93 | 613.31% | 288.73 | 1 853.54 | 641.97% |
| 30.09.2012 | 300.33 | 372.12 | -71.79 | -19.29% | 347.36 | -47.03 | -13.54% |
| 31.08.2012 | 372.12 | 330.27 | 41.85 | 12.67% | 268.63 | 103.49 | 38.52% |
| 31.07.2012 | 330.27 | 481.32 | - 151.05 | -31.38% | 307.72 | 22.55 | 7.33% |
| 30.06.2012 | 481.32 | 255.01 | 226.31 | 88.74% | 442.54 | 38.79 | 8.76% |
| 31.05.2012 | 255.01 | 153.37 | 101.65 | 66.28% | 322.75 | -67.73 | -20.99% |
| 30.04.2012 | 153.37 | 259.75 | - 106.38 | -40.96% | 643.21 | - 489.84 | -76.16% |
| 31.03.2012 | 259.75 | 403.67 | - 143.92 | -35.65% | 414.73 | - 154.98 | -37.37% |
| 29.02.2012 | 403.67 | 497.06 | -93.40 | -18.79% | 217.70 | 185.96 | 85.42% |
| 31.01.2012 | 497.06 | 202.65 | 294.42 | 145.29% | 353.72 | 143.34 | 40.52% |
| 31.12.2011 | 202.65 | 410.74 | - 208.09 | -50.66% | 255.66 | -53.02 | -20.74% |
| 30.11.2011 | 410.74 | 288.73 | 122.01 | 42.26% | 160.09 | 250.64 | 156.56% |
| 31.10.2011 | 288.73 | 347.36 | -58.63 | -16.88% | 204.21 | 84.52 | 41.39% |
| 30.09.2011 | 347.36 | 268.63 | 78.72 | 29.30% | 542.59 | - 195.23 | -35.98% |
| 31.08.2011 | 268.63 | 307.72 | -39.09 | -12.70% | 161.17 | 107.46 | 66.67% |
| 31.07.2011 | 307.72 | 442.54 | - 134.82 | -30.46% | 398.35 | -90.63 | -22.75% |
| 30.06.2011 | 442.54 | 322.75 | 119.79 | 37.12% | 125.13 | 317.41 | 253.67% |
| 31.05.2011 | 322.75 | 643.21 | - 320.46 | -49.82% | 205.20 | 117.55 | 57.29% |
| 30.04.2011 | 643.21 | 414.73 | 228.48 | 55.09% | 165.83 | 477.38 | 287.87% |
| 31.03.2011 | 414.73 | 217.70 | 197.03 | 90.50% | 186.73 | 228.00 | 122.11% |
| 28.02.2011 | 217.70 | 353.72 | - 136.02 | -38.45% | 163.20 | 54.50 | 33.40% |
| 31.01.2011 | 353.72 | 255.66 | 98.06 | 38.35% | 125.10 | 228.62 | 182.76% |
| 31.12.2010 | 255.66 | 160.09 | 95.57 | 59.70% | 92.45 | 163.22 | 176.55% |
| 30.11.2010 | 160.09 | 204.21 | -44.12 | -21.60% | 264.33 | - 104.24 | -39.44% |
| 31.10.2010 | 204.21 | 542.59 | - 338.38 | -62.36% | 209.11 | -4.90 | -2.34% |
| 30.09.2010 | 542.59 | 161.17 | 381.42 | 236.65% | 322.34 | 220.25 | 68.33% |
| 31.08.2010 | 161.17 | 398.35 | - 237.17 | -59.54% | 473.00 | - 311.83 | -65.93% |
| 31.07.2010 | 398.35 | 125.13 | 273.22 | 218.36% | 262.90 | 135.45 | 51.52% |
| 30.06.2010 | 125.13 | 205.20 | -80.07 | -39.02% | 265.05 | - 139.93 | -52.79% |
| 31.05.2010 | 205.20 | 165.83 | 39.37 | 23.74% | 302.36 | -97.16 | -32.13% |
| 30.04.2010 | 165.83 | 186.73 | -20.90 | -11.19% | 136.82 | 29.00 | 21.20% |
| 31.03.2010 | 186.73 | 163.20 | 23.52 | 14.41% | 113.27 | 73.45 | 64.85% |
| 28.02.2010 | 163.20 | 125.10 | 38.10 | 30.46% | 176.32 | -13.12 | -7.44% |
| 31.01.2010 | 125.10 | 92.45 | 32.65 | 35.32% | 117.25 | 7.85 | 6.69% |
| 31.12.2009 | 92.45 | 264.33 | - 171.88 | -65.03% | 131.20 | -38.76 | -29.54% |
| 30.11.2009 | 264.33 | 209.11 | 55.22 | 26.41% | 224.37 | 39.97 | 17.81% |
| 31.10.2009 | 209.11 | 322.34 | - 113.23 | -35.13% | 224.37 | -15.25 | -6.80% |
| 30.09.2009 | 322.34 | 473.00 | - 150.66 | -31.85% | 224.37 | 97.98 | 43.67% |
| 31.08.2009 | 473.00 | 262.90 | 210.10 | 79.92% | 431.95 | 41.05 | 9.50% |
| 31.07.2009 | 262.90 | 265.05 | -2.15 | -0.81% | 431.95 | - 169.05 | -39.14% |
| 30.06.2009 | 265.05 | 302.36 | -37.30 | -12.34% | 431.95 | - 166.90 | -38.64% |
| 31.05.2009 | 302.36 | 136.82 | 165.53 | 120.98% | 316.49 | -14.14 | -4.47% |
| 30.04.2009 | 136.82 | 113.27 | 23.55 | 20.79% | 316.49 | - 179.67 | -56.77% |
| 31.03.2009 | 113.27 | 176.32 | -63.05 | -35.76% | 316.49 | - 203.22 | -64.21% |
| 28.02.2009 | 176.32 | 117.25 | 59.07 | 50.38% | 146.43 | 29.89 | 20.42% |
| 31.01.2009 | 117.25 | 131.20 | -13.95 | -10.64% | 146.43 | -29.18 | -19.93% |
| 31.12.2008 | 131.20 | 224.37 | -93.16 | -41.52% | 146.43 | -15.22 | -10.40% |
| 30.09.2008 | 224.37 | 431.95 | - 207.59 | -48.06% | 413.49 | - 189.12 | -45.74% |
| 30.06.2008 | 431.95 | 316.49 | 115.46 | 36.48% | 289.47 | 142.48 | 49.22% |
| 31.03.2008 | 316.49 | 146.43 | 170.07 | 116.14% | 221.28 | 95.22 | 43.03% |
| 31.12.2007 | 146.43 | 413.49 | - 267.06 | -64.59% | 106.21 | 40.22 | 37.86% |
| 30.09.2007 | 413.49 | 289.47 | 124.02 | 42.84% | 172.29 | 241.20 | 139.99% |
| 30.06.2007 | 289.47 | 221.28 | 68.20 | 30.82% | 125.87 | 163.61 | 129.98% |
| 31.03.2007 | 221.28 | 106.21 | 115.06 | 108.34% | 143.01 | 78.26 | 54.72% |
| 31.12.2006 | 106.21 | 172.29 | -66.08 | -38.36% | 6.56 | 99.65 | 1 518.56% |
| 30.09.2006 | 172.29 | 125.87 | 46.43 | 36.89% | 66.08 | 106.21 | 160.72% |
| 30.06.2006 | 125.87 | 143.01 | -17.15 | -11.99% | 62.55 | 63.32 | 101.23% |
| 31.03.2006 | 143.01 | 6.56 | 136.45 | 2 079.44% | 69.03 | 73.99 | 107.18% |
| 31.12.2005 | 6.56 | 66.08 | -59.52 | -90.07% | 47.98 | -41.42 | -86.32% |
| 30.09.2005 | 66.08 | 62.55 | 3.53 | 5.65% | 86.89 | -20.81 | -23.95% |
| 30.06.2005 | 62.55 | 69.03 | -6.48 | -9.39% | - | - | - |
| 31.03.2005 | 69.03 | 47.98 | 21.05 | 43.86% | - | - | - |
| 31.12.2004 | 47.98 | 86.89 | -38.91 | -44.78% | - | - | - |
| 30.09.2004 | 86.89 | - | - | - | - | - | - |
Graf jako obrázek

Podobné sestavy
Aplikace Ekonomika ČNB ze sekce makroekonomika zobrazuje časové řady hlavních makroekonomických údajů z ekonomiky ČR. Najdete zde přes 10.000 grafů různých hodnot od úrokových sazeb, přes statistiky státního rozpočtu, statistiky ČNB a data zpracovávaná ČSÚ. Data jsou k dispozici obvykle za posledních více než 20 let, od prosince roku 1992. Zdroj dat: ČNB ARAD

