Securities other than shares (Equity Funds Balance Sheet) - ekonomika ČNB
Aktualizace dat Securities other than shares (Equity Funds Balance Sheet) v této aplikaci skončila 30.6.2023. Aktualizovná data časových řad najdete na stránkách nové aplikace z dat ARAD ČNB
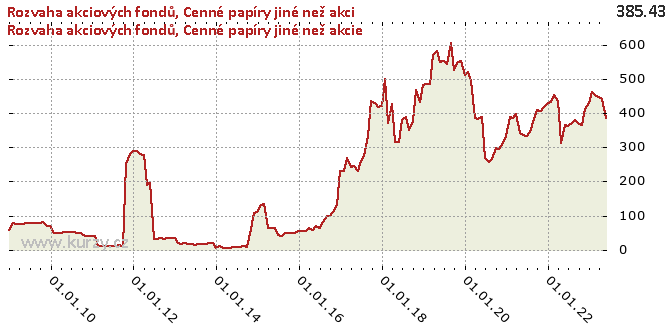
Graf hodnot, Equity Funds Balance Sheet
Meziroční srovnání
Minima a maxima
| Typ | Období | Hodnota |
|---|---|---|
| Max | 31.08.2019 | 606.08 |
| Min | 31.12.2013 | 3.68 |
Historické hodnoty
| Období | Hodnota | Předchozí | Rozdíl | Změna | Před rokem | Rozdíl | Změna |
|---|---|---|---|---|---|---|---|
| 30.06.2020 | 408.02 | 387.23 | 20.79 | 5.37% | 550.90 | - 142.89 | -25.94% |
| 31.05.2020 | 387.23 | 382.38 | 4.84 | 1.27% | 549.86 | - 162.63 | -29.58% |
| 30.04.2020 | 382.38 | 386.75 | -4.37 | -1.13% | 580.61 | - 198.23 | -34.14% |
| 31.03.2020 | 386.75 | 494.01 | - 107.25 | -21.71% | 570.50 | - 183.75 | -32.21% |
| 29.02.2020 | 494.01 | 521.46 | -27.45 | -5.26% | 485.23 | 8.77 | 1.81% |
| 31.01.2020 | 521.46 | 512.26 | 9.20 | 1.79% | 484.87 | 36.59 | 7.55% |
| 31.12.2019 | 512.26 | 552.72 | -40.46 | -7.32% | 480.88 | 31.38 | 6.53% |
| 30.11.2019 | 552.72 | 549.50 | 3.22 | 0.59% | 432.09 | 120.63 | 27.92% |
| 31.10.2019 | 549.50 | 525.13 | 24.37 | 4.64% | 467.72 | 81.78 | 17.48% |
| 30.09.2019 | 525.13 | 606.08 | -80.95 | -13.36% | 376.82 | 148.31 | 39.36% |
| 31.08.2019 | 606.08 | 542.88 | 63.19 | 11.64% | 350.62 | 255.46 | 72.86% |
| 31.07.2019 | 542.88 | 550.90 | -8.02 | -1.46% | 388.55 | 154.34 | 39.72% |
| 30.06.2019 | 550.90 | 549.86 | 1.04 | 0.19% | 379.35 | 171.55 | 45.22% |
| 31.05.2019 | 549.86 | 580.61 | -30.75 | -5.30% | 315.14 | 234.72 | 74.48% |
| 30.04.2019 | 580.61 | 570.50 | 10.11 | 1.77% | 314.57 | 266.05 | 84.58% |
| 31.03.2019 | 570.50 | 485.23 | 85.27 | 17.57% | 427.10 | 143.41 | 33.58% |
| 28.02.2019 | 485.23 | 484.87 | 0.37 | 0.08% | 372.00 | 113.23 | 30.44% |
| 31.01.2019 | 484.87 | 480.88 | 3.98 | 0.83% | 498.46 | -13.59 | -2.73% |
| 31.12.2018 | 480.88 | 432.09 | 48.79 | 11.29% | 419.68 | 61.20 | 14.58% |
| 30.11.2018 | 432.09 | 467.72 | -35.63 | -7.62% | 418.57 | 13.52 | 3.23% |
| 31.10.2018 | 467.72 | 376.82 | 90.90 | 24.12% | 429.13 | 38.59 | 8.99% |
| 30.09.2018 | 376.82 | 350.62 | 26.20 | 7.47% | 433.92 | -57.10 | -13.16% |
| 31.08.2018 | 350.62 | 388.55 | -37.93 | -9.76% | 332.97 | 17.65 | 5.30% |
| 31.07.2018 | 388.55 | 379.35 | 9.20 | 2.42% | 275.58 | 112.97 | 40.99% |
| 30.06.2018 | 379.35 | 315.14 | 64.21 | 20.37% | 259.22 | 120.13 | 46.34% |
| 31.05.2018 | 315.14 | 314.57 | 0.57 | 0.18% | 229.15 | 86.00 | 37.53% |
| 30.04.2018 | 314.57 | 427.10 | - 112.53 | -26.35% | 244.51 | 70.06 | 28.65% |
| 31.03.2018 | 427.10 | 372.00 | 55.09 | 14.81% | 243.42 | 183.68 | 75.46% |
| 28.02.2018 | 372.00 | 498.46 | - 126.46 | -25.37% | 269.75 | 102.25 | 37.90% |
| 31.01.2018 | 498.46 | 419.68 | 78.78 | 18.77% | 231.15 | 267.31 | 115.64% |
| 31.12.2017 | 419.68 | 418.57 | 1.11 | 0.26% | 230.55 | 189.13 | 82.03% |
| 30.11.2017 | 418.57 | 429.13 | -10.56 | -2.46% | 131.19 | 287.38 | 219.05% |
| 31.10.2017 | 429.13 | 433.92 | -4.79 | -1.10% | 109.48 | 319.65 | 291.97% |
| 30.09.2017 | 433.92 | 332.97 | 100.95 | 30.32% | 99.01 | 334.91 | 338.24% |
| 31.08.2017 | 332.97 | 275.58 | 57.40 | 20.83% | 99.40 | 233.57 | 234.98% |
| 31.07.2017 | 275.58 | 259.22 | 16.36 | 6.31% | 80.43 | 195.15 | 242.64% |
| 30.06.2017 | 259.22 | 229.15 | 30.07 | 13.12% | 62.64 | 196.58 | 313.83% |
| 31.05.2017 | 229.15 | 244.51 | -15.37 | -6.28% | 70.12 | 159.03 | 226.80% |
| 30.04.2017 | 244.51 | 243.42 | 1.09 | 0.45% | 58.38 | 186.13 | 318.81% |
| 31.03.2017 | 243.42 | 269.75 | -26.33 | -9.76% | 62.08 | 181.34 | 292.08% |
| 28.02.2017 | 269.75 | 231.15 | 38.60 | 16.70% | 54.44 | 215.31 | 395.49% |
| 31.01.2017 | 231.15 | 230.55 | 0.60 | 0.26% | 54.81 | 176.34 | 321.75% |
| 31.12.2016 | 230.55 | 131.19 | 99.36 | 75.74% | 54.84 | 175.72 | 320.44% |
| 30.11.2016 | 131.19 | 109.48 | 21.71 | 19.83% | 49.70 | 81.49 | 163.95% |
| 31.10.2016 | 109.48 | 99.01 | 10.47 | 10.57% | 49.45 | 60.03 | 121.41% |
| 30.09.2016 | 99.01 | 99.40 | -0.39 | -0.39% | 49.13 | 49.89 | 101.54% |
| 31.08.2016 | 99.40 | 80.43 | 18.97 | 23.59% | 48.91 | 50.49 | 103.24% |
| 31.07.2016 | 80.43 | 62.64 | 17.79 | 28.40% | 40.03 | 40.40 | 100.93% |
| 30.06.2016 | 62.64 | 70.12 | -7.48 | -10.67% | 42.34 | 20.30 | 47.93% |
| 31.05.2016 | 70.12 | 58.38 | 11.74 | 20.10% | 63.83 | 6.29 | 9.86% |
| 30.04.2016 | 58.38 | 62.08 | -3.70 | -5.96% | 63.41 | -5.03 | -7.93% |
| 31.03.2016 | 62.08 | 54.44 | 7.64 | 14.04% | 63.87 | -1.79 | -2.80% |
| 29.02.2016 | 54.44 | 54.81 | -0.37 | -0.67% | 133.44 | -79.00 | -59.20% |
| 31.01.2016 | 54.81 | 54.84 | -0.03 | -0.05% | 132.06 | -77.26 | -58.50% |
| 31.12.2015 | 54.84 | 49.70 | 5.13 | 10.32% | 109.79 | -54.95 | -50.05% |
| 30.11.2015 | 49.70 | 49.45 | 0.26 | 0.52% | 108.75 | -59.04 | -54.29% |
| 31.10.2015 | 49.45 | 49.13 | 0.32 | 0.65% | 60.40 | -10.95 | -18.13% |
| 30.09.2015 | 49.13 | 48.91 | 0.22 | 0.45% | 8.89 | 40.24 | 452.62% |
| 31.08.2015 | 48.91 | 40.03 | 8.88 | 22.18% | 9.42 | 39.49 | 419.36% |
| 31.07.2015 | 40.03 | 42.34 | -2.31 | -5.46% | 7.24 | 32.78 | 452.57% |
| 30.06.2015 | 42.34 | 63.83 | -21.48 | -33.66% | 7.91 | 34.43 | 435.23% |
| 31.05.2015 | 63.83 | 63.41 | 0.41 | 0.65% | 6.79 | 57.03 | 839.71% |
| 30.04.2015 | 63.41 | 63.87 | -0.46 | -0.72% | 4.55 | 58.87 | 1 294.90% |
| 31.03.2015 | 63.87 | 133.44 | -69.57 | -52.13% | 4.40 | 59.47 | 1 351.64% |
| 28.02.2015 | 133.44 | 132.06 | 1.38 | 1.04% | 4.43 | 129.01 | 2 909.49% |
| 31.01.2015 | 132.06 | 109.79 | 22.28 | 20.29% | 10.47 | 121.59 | 1 161.00% |
| 31.12.2014 | 109.79 | 108.75 | 1.04 | 0.96% | 3.68 | 106.11 | 2 883.40% |
| 30.11.2014 | 108.75 | 60.40 | 48.35 | 80.04% | 18.55 | 90.19 | 486.11% |
| 31.10.2014 | 60.40 | 8.89 | 51.51 | 579.41% | 18.81 | 41.59 | 221.17% |
| 30.09.2014 | 8.89 | 9.42 | -0.53 | -5.60% | 16.98 | -8.09 | -47.65% |
| 31.08.2014 | 9.42 | 7.24 | 2.17 | 30.00% | 16.91 | -7.49 | -44.31% |
| 31.07.2014 | 7.24 | 7.91 | -0.67 | -8.43% | 17.41 | -10.16 | -58.39% |
| 30.06.2014 | 7.91 | 6.79 | 1.12 | 16.48% | 15.06 | -7.15 | -47.49% |
| 31.05.2014 | 6.79 | 4.55 | 2.25 | 49.41% | 17.05 | -10.26 | -60.17% |
| 30.04.2014 | 4.55 | 4.40 | 0.15 | 3.32% | 17.13 | -12.58 | -73.46% |
| 31.03.2014 | 4.40 | 4.43 | -0.03 | -0.77% | 18.41 | -14.01 | -76.10% |
| 28.02.2014 | 4.43 | 10.47 | -6.04 | -57.66% | 18.06 | -13.62 | -75.44% |
| 31.01.2014 | 10.47 | 3.68 | 6.79 | 184.59% | 19.34 | -8.87 | -45.85% |
| 31.12.2013 | 3.68 | 18.55 | -14.87 | -80.17% | 33.88 | -30.20 | -89.14% |
| 30.11.2013 | 18.55 | 18.81 | -0.25 | -1.34% | 33.94 | -15.39 | -45.33% |
| 31.10.2013 | 18.81 | 16.98 | 1.82 | 10.74% | 33.71 | -14.90 | -44.21% |
| 30.09.2013 | 16.98 | 16.91 | 0.07 | 0.42% | 31.41 | -14.43 | -45.94% |
| 31.08.2013 | 16.91 | 17.41 | -0.50 | -2.86% | 33.49 | -16.58 | -49.51% |
| 31.07.2013 | 17.41 | 15.06 | 2.34 | 15.56% | 32.13 | -14.73 | -45.83% |
| 30.06.2013 | 15.06 | 17.05 | -1.99 | -11.66% | 31.43 | -16.36 | -52.06% |
| 31.05.2013 | 17.05 | 17.13 | -0.08 | -0.44% | 197.02 | - 179.96 | -91.34% |
| 30.04.2013 | 17.13 | 18.41 | -1.28 | -6.97% | 190.40 | - 173.27 | -91.00% |
| 31.03.2013 | 18.41 | 18.06 | 0.35 | 1.97% | 278.16 | - 259.75 | -93.38% |
| 28.02.2013 | 18.06 | 19.34 | -1.28 | -6.63% | 280.93 | - 262.88 | -93.57% |
| 31.01.2013 | 19.34 | 33.88 | -14.55 | -42.93% | 287.60 | - 268.26 | -93.28% |
| 31.12.2012 | 33.88 | 33.94 | -0.06 | -0.16% | 289.97 | - 256.09 | -88.31% |
| 30.11.2012 | 33.94 | 33.71 | 0.23 | 0.68% | 279.00 | - 245.06 | -87.84% |
| 31.10.2012 | 33.71 | 31.41 | 2.30 | 7.32% | 251.20 | - 217.49 | -86.58% |
| 30.09.2012 | 31.41 | 33.49 | -2.08 | -6.21% | 11.51 | 19.90 | 172.87% |
| 31.08.2012 | 33.49 | 32.13 | 1.36 | 4.23% | 13.95 | 19.54 | 140.08% |
| 31.07.2012 | 32.13 | 31.43 | 0.71 | 2.26% | 10.10 | 22.04 | 218.17% |
| 30.06.2012 | 31.43 | 197.02 | - 165.59 | -84.05% | 9.97 | 21.46 | 215.33% |
| 31.05.2012 | 197.02 | 190.40 | 6.61 | 3.47% | 9.96 | 187.05 | 1 877.28% |
| 30.04.2012 | 190.40 | 278.16 | -87.75 | -31.55% | 9.86 | 180.55 | 1 831.65% |
| 31.03.2012 | 278.16 | 280.93 | -2.77 | -0.99% | 9.98 | 268.18 | 2 686.86% |
| 29.02.2012 | 280.93 | 287.60 | -6.67 | -2.32% | 9.84 | 271.09 | 2 754.71% |
| 31.01.2012 | 287.60 | 289.97 | -2.37 | -0.82% | 39.95 | 247.65 | 619.88% |
| 31.12.2011 | 289.97 | 279.00 | 10.97 | 3.93% | 40.88 | 249.10 | 609.36% |
| 30.11.2011 | 279.00 | 251.20 | 27.80 | 11.07% | 40.52 | 238.49 | 588.64% |
| 31.10.2011 | 251.20 | 11.51 | 239.69 | 2 082.11% | 40.17 | 211.03 | 525.29% |
| 30.09.2011 | 11.51 | 13.95 | -2.44 | -17.48% | 50.10 | -38.59 | -77.02% |
| 31.08.2011 | 13.95 | 10.10 | 3.85 | 38.13% | 50.11 | -36.16 | -72.16% |
| 31.07.2011 | 10.10 | 9.97 | 0.13 | 1.34% | 50.45 | -40.35 | -79.98% |
| 30.06.2011 | 9.97 | 9.96 | 0.00 | 0.02% | 50.89 | -40.92 | -80.42% |
| 31.05.2011 | 9.96 | 9.86 | 0.11 | 1.09% | 50.88 | -40.91 | -80.42% |
| 30.04.2011 | 9.86 | 9.98 | -0.12 | -1.24% | 50.86 | -41.01 | -80.62% |
| 31.03.2011 | 9.98 | 9.84 | 0.14 | 1.42% | 49.98 | -40.00 | -80.03% |
| 28.02.2011 | 9.84 | 39.95 | -30.11 | -75.37% | 49.23 | -39.39 | -80.01% |
| 31.01.2011 | 39.95 | 40.88 | -0.93 | -2.27% | 50.14 | -10.19 | -20.32% |
| 31.12.2010 | 40.88 | 40.52 | 0.36 | 0.90% | 69.28 | -28.40 | -41.00% |
| 30.11.2010 | 40.52 | 40.17 | 0.34 | 0.85% | 68.92 | -28.40 | -41.21% |
| 31.10.2010 | 40.17 | 50.10 | -9.92 | -19.81% | 79.69 | -39.52 | -49.59% |
| 30.09.2010 | 50.10 | 50.11 | -0.01 | -0.03% | 78.38 | -28.28 | -36.08% |
| 31.08.2010 | 50.11 | 50.45 | -0.34 | -0.67% | 78.44 | -28.33 | -36.12% |
| 31.07.2010 | 50.45 | 50.89 | -0.44 | -0.87% | 78.23 | -27.78 | -35.51% |
| 30.06.2010 | 50.89 | 50.88 | 0.01 | 0.03% | 77.80 | -26.91 | -34.59% |
| 31.05.2010 | 50.88 | 50.86 | 0.01 | 0.03% | 77.89 | -27.02 | -34.68% |
| 30.04.2010 | 50.86 | 49.98 | 0.89 | 1.77% | 76.51 | -25.65 | -33.52% |
| 31.03.2010 | 49.98 | 49.23 | 0.74 | 1.51% | 75.81 | -25.83 | -34.08% |
| 28.02.2010 | 49.23 | 50.14 | -0.91 | -1.81% | 76.17 | -26.94 | -35.37% |
| 31.01.2010 | 50.14 | 69.28 | -19.14 | -27.63% | 77.77 | -27.63 | -35.53% |
| 31.12.2009 | 69.28 | 68.92 | 0.36 | 0.52% | 57.99 | 11.29 | 19.46% |
| 30.11.2009 | 68.92 | 79.69 | -10.77 | -13.52% | - | - | - |
| 31.10.2009 | 79.69 | 78.38 | 1.32 | 1.68% | - | - | - |
| 30.09.2009 | 78.38 | 78.44 | -0.07 | -0.09% | - | - | - |
| 31.08.2009 | 78.44 | 78.23 | 0.22 | 0.28% | - | - | - |
| 31.07.2009 | 78.23 | 77.80 | 0.43 | 0.55% | - | - | - |
| 30.06.2009 | 77.80 | 77.89 | -0.10 | -0.12% | - | - | - |
| 31.05.2009 | 77.89 | 76.51 | 1.38 | 1.80% | - | - | - |
| 30.04.2009 | 76.51 | 75.81 | 0.70 | 0.92% | - | - | - |
| 31.03.2009 | 75.81 | 76.17 | -0.36 | -0.48% | - | - | - |
| 28.02.2009 | 76.17 | 77.77 | -1.59 | -2.05% | - | - | - |
| 31.01.2009 | 77.77 | 57.99 | 19.78 | 34.10% | - | - | - |
| 31.12.2008 | 57.99 | - | - | - | - | - | - |
Graf jako obrázek

Podobné sestavy
Aplikace Ekonomika ČNB ze sekce makroekonomika zobrazuje časové řady hlavních makroekonomických údajů z ekonomiky ČR. Najdete zde přes 10.000 grafů různých hodnot od úrokových sazeb, přes statistiky státního rozpočtu, statistiky ČNB a data zpracovávaná ČSÚ. Data jsou k dispozici obvykle za posledních více než 20 let, od prosince roku 1992. Zdroj dat: ČNB ARAD

