Trade credits and advances (AF.81) (Financial assets, stocks, Central government) - ekonomika ČNB
Aktualizace dat Trade credits and advances (AF.81) (Financial assets, stocks, Central government) v této aplikaci skončila 30.6.2023. Aktualizovná data časových řad najdete na stránkách nové aplikace z dat ARAD ČNB
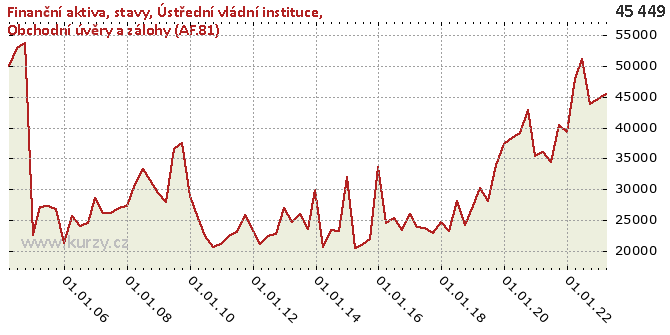
Graf hodnot, Financial assets, stocks, Central government
Meziroční srovnání
Minima a maxima
| Typ | Období | Hodnota |
|---|---|---|
| Min | 31.03.2015 | 20 366.00 |
| Max | 30.09.2004 | 53 835.00 |
Historické hodnoty
| Období | Hodnota | Předchozí | Rozdíl | Změna | Před rokem | Rozdíl | Změna |
|---|---|---|---|---|---|---|---|
| 31.03.2020 | 38 259.00 | 37 337.00 | 922.00 | 2.47% | 30 227.00 | 8 032.00 | 26.57% |
| 31.12.2019 | 37 337.00 | 33 870.00 | 3 467.00 | 10.24% | 27 319.00 | 10 018.00 | 36.67% |
| 30.09.2019 | 33 870.00 | 28 119.00 | 5 751.00 | 20.45% | 24 204.00 | 9 666.00 | 39.94% |
| 30.06.2019 | 28 119.00 | 30 227.00 | -2 108.00 | -6.97% | 28 024.00 | 95.00 | 0.34% |
| 31.03.2019 | 30 227.00 | 27 319.00 | 2 908.00 | 10.64% | 23 173.00 | 7 054.00 | 30.44% |
| 31.12.2018 | 27 319.00 | 24 204.00 | 3 115.00 | 12.87% | 24 717.00 | 2 602.00 | 10.53% |
| 30.09.2018 | 24 204.00 | 28 024.00 | -3 820.00 | -13.63% | 22 884.00 | 1 320.00 | 5.77% |
| 30.06.2018 | 28 024.00 | 23 173.00 | 4 851.00 | 20.93% | 23 708.00 | 4 316.00 | 18.20% |
| 31.03.2018 | 23 173.00 | 24 717.00 | -1 544.00 | -6.25% | 23 835.00 | - 662.00 | -2.78% |
| 31.12.2017 | 24 717.00 | 22 884.00 | 1 833.00 | 8.01% | 25 956.00 | -1 239.00 | -4.77% |
| 30.09.2017 | 22 884.00 | 23 708.00 | - 824.00 | -3.48% | 23 365.00 | - 481.00 | -2.06% |
| 30.06.2017 | 23 708.00 | 23 835.00 | - 127.00 | -0.53% | 25 278.00 | -1 570.00 | -6.21% |
| 31.03.2017 | 23 835.00 | 25 956.00 | -2 121.00 | -8.17% | 24 476.00 | - 641.00 | -2.62% |
| 31.12.2016 | 25 956.00 | 23 365.00 | 2 591.00 | 11.09% | 33 570.00 | -7 614.00 | -22.68% |
| 30.09.2016 | 23 365.00 | 25 278.00 | -1 913.00 | -7.57% | 21 966.00 | 1 399.00 | 6.37% |
| 30.06.2016 | 25 278.00 | 24 476.00 | 802.00 | 3.28% | 20 886.00 | 4 392.00 | 21.03% |
| 31.03.2016 | 24 476.00 | 33 570.00 | -9 094.00 | -27.09% | 20 366.00 | 4 110.00 | 20.18% |
| 31.12.2015 | 33 570.00 | 21 966.00 | 11 604.00 | 52.83% | 32 053.00 | 1 517.00 | 4.73% |
| 30.09.2015 | 21 966.00 | 20 886.00 | 1 080.00 | 5.17% | 23 231.00 | -1 265.00 | -5.45% |
| 30.06.2015 | 20 886.00 | 20 366.00 | 520.00 | 2.55% | 23 344.00 | -2 458.00 | -10.53% |
| 31.03.2015 | 20 366.00 | 32 053.00 | -11 687.00 | -36.46% | 20 585.00 | - 219.00 | -1.06% |
| 31.12.2014 | 32 053.00 | 23 231.00 | 8 822.00 | 37.98% | 29 907.00 | 2 146.00 | 7.18% |
| 30.09.2014 | 23 231.00 | 23 344.00 | - 113.00 | -0.48% | 23 499.00 | - 268.00 | -1.14% |
| 30.06.2014 | 23 344.00 | 20 585.00 | 2 759.00 | 13.40% | 26 008.00 | -2 664.00 | -10.24% |
| 31.03.2014 | 20 585.00 | 29 907.00 | -9 322.00 | -31.17% | 24 612.00 | -4 027.00 | -16.36% |
| 31.12.2013 | 29 907.00 | 23 499.00 | 6 408.00 | 27.27% | 26 858.00 | 3 049.00 | 11.35% |
| 30.09.2013 | 23 499.00 | 26 008.00 | -2 509.00 | -9.65% | 22 705.00 | 794.00 | 3.50% |
| 30.06.2013 | 26 008.00 | 24 612.00 | 1 396.00 | 5.67% | 22 378.00 | 3 630.00 | 16.22% |
| 31.03.2013 | 24 612.00 | 26 858.00 | -2 246.00 | -8.36% | 21 096.00 | 3 516.00 | 16.67% |
| 31.12.2012 | 26 858.00 | 22 705.00 | 4 153.00 | 18.29% | 23 268.00 | 3 590.00 | 15.43% |
| 30.09.2012 | 22 705.00 | 22 378.00 | 327.00 | 1.46% | 25 765.00 | -3 060.00 | -11.88% |
| 30.06.2012 | 22 378.00 | 21 096.00 | 1 282.00 | 6.08% | 23 093.00 | - 715.00 | -3.10% |
| 31.03.2012 | 21 096.00 | 23 268.00 | -2 172.00 | -9.33% | 22 446.00 | -1 350.00 | -6.01% |
| 31.12.2011 | 23 268.00 | 25 765.00 | -2 497.00 | -9.69% | 21 057.00 | 2 211.00 | 10.50% |
| 30.09.2011 | 25 765.00 | 23 093.00 | 2 672.00 | 11.57% | 20 575.00 | 5 190.00 | 25.22% |
| 30.06.2011 | 23 093.00 | 22 446.00 | 647.00 | 2.88% | 22 332.00 | 761.00 | 3.41% |
| 31.03.2011 | 22 446.00 | 21 057.00 | 1 389.00 | 6.60% | 25 359.00 | -2 913.00 | -11.49% |
| 31.12.2010 | 21 057.00 | 20 575.00 | 482.00 | 2.34% | 28 827.00 | -7 770.00 | -26.95% |
| 30.09.2010 | 20 575.00 | 22 332.00 | -1 757.00 | -7.87% | 37 558.00 | -16 983.00 | -45.22% |
| 30.06.2010 | 22 332.00 | 25 359.00 | -3 027.00 | -11.94% | 36 538.00 | -14 206.00 | -38.88% |
| 31.03.2010 | 25 359.00 | 28 827.00 | -3 468.00 | -12.03% | 27 903.00 | -2 544.00 | -9.12% |
| 31.12.2009 | 28 827.00 | 37 558.00 | -8 731.00 | -23.25% | 29 317.00 | - 490.00 | -1.67% |
| 30.09.2009 | 37 558.00 | 36 538.00 | 1 020.00 | 2.79% | 31 516.00 | 6 042.00 | 19.17% |
| 30.06.2009 | 36 538.00 | 27 903.00 | 8 635.00 | 30.95% | 33 287.00 | 3 251.00 | 9.77% |
| 31.03.2009 | 27 903.00 | 29 317.00 | -1 414.00 | -4.82% | 30 885.00 | -2 982.00 | -9.66% |
| 31.12.2008 | 29 317.00 | 31 516.00 | -2 199.00 | -6.98% | 27 286.00 | 2 031.00 | 7.44% |
| 30.09.2008 | 31 516.00 | 33 287.00 | -1 771.00 | -5.32% | 26 985.00 | 4 531.00 | 16.79% |
| 30.06.2008 | 33 287.00 | 30 885.00 | 2 402.00 | 7.78% | 26 181.00 | 7 106.00 | 27.14% |
| 31.03.2008 | 30 885.00 | 27 286.00 | 3 599.00 | 13.19% | 26 107.00 | 4 778.00 | 18.30% |
| 31.12.2007 | 27 286.00 | 26 985.00 | 301.00 | 1.12% | 28 502.00 | -1 216.00 | -4.27% |
| 30.09.2007 | 26 985.00 | 26 181.00 | 804.00 | 3.07% | 24 433.00 | 2 552.00 | 10.44% |
| 30.06.2007 | 26 181.00 | 26 107.00 | 74.00 | 0.28% | 24 003.00 | 2 178.00 | 9.07% |
| 31.03.2007 | 26 107.00 | 28 502.00 | -2 395.00 | -8.40% | 25 671.00 | 436.00 | 1.70% |
| 31.12.2006 | 28 502.00 | 24 433.00 | 4 069.00 | 16.65% | 21 275.00 | 7 227.00 | 33.97% |
| 30.09.2006 | 24 433.00 | 24 003.00 | 430.00 | 1.79% | 26 709.00 | -2 276.00 | -8.52% |
| 30.06.2006 | 24 003.00 | 25 671.00 | -1 668.00 | -6.50% | 27 298.00 | -3 295.00 | -12.07% |
| 31.03.2006 | 25 671.00 | 21 275.00 | 4 396.00 | 20.66% | 27 087.00 | -1 416.00 | -5.23% |
| 31.12.2005 | 21 275.00 | 26 709.00 | -5 434.00 | -20.35% | 22 480.00 | -1 205.00 | -5.36% |
| 30.09.2005 | 26 709.00 | 27 298.00 | - 589.00 | -2.16% | 53 835.00 | -27 126.00 | -50.39% |
| 30.06.2005 | 27 298.00 | 27 087.00 | 211.00 | 0.78% | 52 873.00 | -25 575.00 | -48.37% |
| 31.03.2005 | 27 087.00 | 22 480.00 | 4 607.00 | 20.49% | 50 046.00 | -22 959.00 | -45.88% |
| 31.12.2004 | 22 480.00 | 53 835.00 | -31 355.00 | -58.24% | - | - | - |
| 30.09.2004 | 53 835.00 | 52 873.00 | 962.00 | 1.82% | - | - | - |
| 30.06.2004 | 52 873.00 | 50 046.00 | 2 827.00 | 5.65% | - | - | - |
| 31.03.2004 | 50 046.00 | - | - | - | - | - | - |
Graf jako obrázek

Podobné sestavy
Aplikace Ekonomika ČNB ze sekce makroekonomika zobrazuje časové řady hlavních makroekonomických údajů z ekonomiky ČR. Najdete zde přes 10.000 grafů různých hodnot od úrokových sazeb, přes statistiky státního rozpočtu, statistiky ČNB a data zpracovávaná ČSÚ. Data jsou k dispozici obvykle za posledních více než 20 let, od prosince roku 1992. Zdroj dat: ČNB ARAD

