Trade credits and advances (AF.81) (Financial assets, stocks, Local government) - ekonomika ČNB
Aktualizace dat Trade credits and advances (AF.81) (Financial assets, stocks, Local government) v této aplikaci skončila 30.6.2023. Aktualizovná data časových řad najdete na stránkách nové aplikace z dat ARAD ČNB
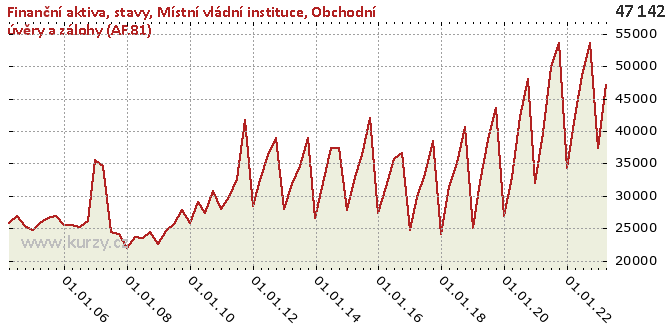
Graf hodnot, Financial assets, stocks, Local government
Meziroční srovnání
Minima a maxima
| Typ | Období | Hodnota |
|---|---|---|
| Max | 30.09.2019 | 43 514.00 |
| Min | 31.12.2007 | 21 879.00 |
Historické hodnoty
| Období | Hodnota | Předchozí | Rozdíl | Změna | Před rokem | Rozdíl | Změna |
|---|---|---|---|---|---|---|---|
| 31.03.2020 | 32 835.00 | 26 922.00 | 5 913.00 | 21.96% | 32 186.00 | 649.00 | 2.02% |
| 31.12.2019 | 26 922.00 | 43 514.00 | -16 592.00 | -38.13% | 25 052.00 | 1 870.00 | 7.46% |
| 30.09.2019 | 43 514.00 | 38 568.00 | 4 946.00 | 12.82% | 40 653.00 | 2 861.00 | 7.04% |
| 30.06.2019 | 38 568.00 | 32 186.00 | 6 382.00 | 19.83% | 35 063.00 | 3 505.00 | 10.00% |
| 31.03.2019 | 32 186.00 | 25 052.00 | 7 134.00 | 28.48% | 31 290.00 | 896.00 | 2.86% |
| 31.12.2018 | 25 052.00 | 40 653.00 | -15 601.00 | -38.38% | 24 144.00 | 908.00 | 3.76% |
| 30.09.2018 | 40 653.00 | 35 063.00 | 5 590.00 | 15.94% | 38 481.00 | 2 172.00 | 5.64% |
| 30.06.2018 | 35 063.00 | 31 290.00 | 3 773.00 | 12.06% | 33 314.00 | 1 749.00 | 5.25% |
| 31.03.2018 | 31 290.00 | 24 144.00 | 7 146.00 | 29.60% | 29 838.00 | 1 452.00 | 4.87% |
| 31.12.2017 | 24 144.00 | 38 481.00 | -14 337.00 | -37.26% | 24 763.00 | - 619.00 | -2.50% |
| 30.09.2017 | 38 481.00 | 33 314.00 | 5 167.00 | 15.51% | 36 644.00 | 1 837.00 | 5.01% |
| 30.06.2017 | 33 314.00 | 29 838.00 | 3 476.00 | 11.65% | 35 615.00 | -2 301.00 | -6.46% |
| 31.03.2017 | 29 838.00 | 24 763.00 | 5 075.00 | 20.49% | 31 296.00 | -1 458.00 | -4.66% |
| 31.12.2016 | 24 763.00 | 36 644.00 | -11 881.00 | -32.42% | 27 405.00 | -2 642.00 | -9.64% |
| 30.09.2016 | 36 644.00 | 35 615.00 | 1 029.00 | 2.89% | 41 936.00 | -5 292.00 | -12.62% |
| 30.06.2016 | 35 615.00 | 31 296.00 | 4 319.00 | 13.80% | 36 356.00 | - 741.00 | -2.04% |
| 31.03.2016 | 31 296.00 | 27 405.00 | 3 891.00 | 14.20% | 32 936.00 | -1 640.00 | -4.98% |
| 31.12.2015 | 27 405.00 | 41 936.00 | -14 531.00 | -34.65% | 27 830.00 | - 425.00 | -1.53% |
| 30.09.2015 | 41 936.00 | 36 356.00 | 5 580.00 | 15.35% | 37 405.00 | 4 531.00 | 12.11% |
| 30.06.2015 | 36 356.00 | 32 936.00 | 3 420.00 | 10.38% | 37 405.00 | -1 049.00 | -2.80% |
| 31.03.2015 | 32 936.00 | 27 830.00 | 5 106.00 | 18.35% | 32 049.00 | 887.00 | 2.77% |
| 31.12.2014 | 27 830.00 | 37 405.00 | -9 575.00 | -25.60% | 26 542.00 | 1 288.00 | 4.85% |
| 30.09.2014 | 37 405.00 | 37 405.00 | 0.00 | 0.00 | 38 972.00 | -1 567.00 | -4.02% |
| 30.06.2014 | 37 405.00 | 32 049.00 | 5 356.00 | 16.71% | 34 573.00 | 2 832.00 | 8.19% |
| 31.03.2014 | 32 049.00 | 26 542.00 | 5 507.00 | 20.75% | 31 896.00 | 153.00 | 0.48% |
| 31.12.2013 | 26 542.00 | 38 972.00 | -12 430.00 | -31.89% | 27 920.00 | -1 378.00 | -4.94% |
| 30.09.2013 | 38 972.00 | 34 573.00 | 4 399.00 | 12.72% | 38 905.00 | 67.00 | 0.17% |
| 30.06.2013 | 34 573.00 | 31 896.00 | 2 677.00 | 8.39% | 36 232.00 | -1 659.00 | -4.58% |
| 31.03.2013 | 31 896.00 | 27 920.00 | 3 976.00 | 14.24% | 32 402.00 | - 506.00 | -1.56% |
| 31.12.2012 | 27 920.00 | 38 905.00 | -10 985.00 | -28.24% | 28 387.00 | - 467.00 | -1.65% |
| 30.09.2012 | 38 905.00 | 36 232.00 | 2 673.00 | 7.38% | 41 707.00 | -2 802.00 | -6.72% |
| 30.06.2012 | 36 232.00 | 32 402.00 | 3 830.00 | 11.82% | 32 630.00 | 3 602.00 | 11.04% |
| 31.03.2012 | 32 402.00 | 28 387.00 | 4 015.00 | 14.14% | 29 878.00 | 2 524.00 | 8.45% |
| 31.12.2011 | 28 387.00 | 41 707.00 | -13 320.00 | -31.94% | 28 035.00 | 352.00 | 1.26% |
| 30.09.2011 | 41 707.00 | 32 630.00 | 9 077.00 | 27.82% | 30 807.00 | 10 900.00 | 35.38% |
| 30.06.2011 | 32 630.00 | 29 878.00 | 2 752.00 | 9.21% | 27 421.00 | 5 209.00 | 19.00% |
| 31.03.2011 | 29 878.00 | 28 035.00 | 1 843.00 | 6.57% | 29 036.00 | 842.00 | 2.90% |
| 31.12.2010 | 28 035.00 | 30 807.00 | -2 772.00 | -9.00% | 25 857.00 | 2 178.00 | 8.42% |
| 30.09.2010 | 30 807.00 | 27 421.00 | 3 386.00 | 12.35% | 27 794.00 | 3 013.00 | 10.84% |
| 30.06.2010 | 27 421.00 | 29 036.00 | -1 615.00 | -5.56% | 25 573.00 | 1 848.00 | 7.23% |
| 31.03.2010 | 29 036.00 | 25 857.00 | 3 179.00 | 12.29% | 24 635.00 | 4 401.00 | 17.86% |
| 31.12.2009 | 25 857.00 | 27 794.00 | -1 937.00 | -6.97% | 22 532.00 | 3 325.00 | 14.76% |
| 30.09.2009 | 27 794.00 | 25 573.00 | 2 221.00 | 8.68% | 24 375.00 | 3 419.00 | 14.03% |
| 30.06.2009 | 25 573.00 | 24 635.00 | 938.00 | 3.81% | 23 438.00 | 2 135.00 | 9.11% |
| 31.03.2009 | 24 635.00 | 22 532.00 | 2 103.00 | 9.33% | 23 620.00 | 1 015.00 | 4.30% |
| 31.12.2008 | 22 532.00 | 24 375.00 | -1 843.00 | -7.56% | 21 879.00 | 653.00 | 2.98% |
| 30.09.2008 | 24 375.00 | 23 438.00 | 937.00 | 4.00% | 24 086.00 | 289.00 | 1.20% |
| 30.06.2008 | 23 438.00 | 23 620.00 | - 182.00 | -0.77% | 24 424.00 | - 986.00 | -4.04% |
| 31.03.2008 | 23 620.00 | 21 879.00 | 1 741.00 | 7.96% | 34 660.00 | -11 040.00 | -31.85% |
| 31.12.2007 | 21 879.00 | 24 086.00 | -2 207.00 | -9.16% | 35 518.00 | -13 639.00 | -38.40% |
| 30.09.2007 | 24 086.00 | 24 424.00 | - 338.00 | -1.38% | 26 133.00 | -2 047.00 | -7.83% |
| 30.06.2007 | 24 424.00 | 34 660.00 | -10 236.00 | -29.53% | 25 146.00 | - 722.00 | -2.87% |
| 31.03.2007 | 34 660.00 | 35 518.00 | - 858.00 | -2.42% | 25 447.00 | 9 213.00 | 36.20% |
| 31.12.2006 | 35 518.00 | 26 133.00 | 9 385.00 | 35.91% | 25 455.00 | 10 063.00 | 39.53% |
| 30.09.2006 | 26 133.00 | 25 146.00 | 987.00 | 3.92% | 26 807.00 | - 674.00 | -2.51% |
| 30.06.2006 | 25 146.00 | 25 447.00 | - 301.00 | -1.18% | 26 518.00 | -1 372.00 | -5.17% |
| 31.03.2006 | 25 447.00 | 25 455.00 | -8.00 | -0.03% | 25 837.00 | - 390.00 | -1.51% |
| 31.12.2005 | 25 455.00 | 26 807.00 | -1 352.00 | -5.04% | 24 754.00 | 701.00 | 2.83% |
| 30.09.2005 | 26 807.00 | 26 518.00 | 289.00 | 1.09% | 25 295.00 | 1 512.00 | 5.98% |
| 30.06.2005 | 26 518.00 | 25 837.00 | 681.00 | 2.64% | 26 833.00 | - 315.00 | -1.17% |
| 31.03.2005 | 25 837.00 | 24 754.00 | 1 083.00 | 4.38% | 25 791.00 | 46.00 | 0.18% |
| 31.12.2004 | 24 754.00 | 25 295.00 | - 541.00 | -2.14% | - | - | - |
| 30.09.2004 | 25 295.00 | 26 833.00 | -1 538.00 | -5.73% | - | - | - |
| 30.06.2004 | 26 833.00 | 25 791.00 | 1 042.00 | 4.04% | - | - | - |
| 31.03.2004 | 25 791.00 | - | - | - | - | - | - |
Graf jako obrázek

Podobné sestavy
Aplikace Ekonomika ČNB ze sekce makroekonomika zobrazuje časové řady hlavních makroekonomických údajů z ekonomiky ČR. Najdete zde přes 10.000 grafů různých hodnot od úrokových sazeb, přes statistiky státního rozpočtu, statistiky ČNB a data zpracovávaná ČSÚ. Data jsou k dispozici obvykle za posledních více než 20 let, od prosince roku 1992. Zdroj dat: ČNB ARAD

