Securities other than shares (Financial assets, transactions, quaterly, Rest of the world) - ekonomika ČNB
Aktualizace dat Securities other than shares (Financial assets, transactions, quaterly, Rest of the world) v této aplikaci skončila 30.6.2023. Aktualizovná data časových řad najdete na stránkách nové aplikace z dat ARAD ČNB
Nové časové řady makroekonomiky a jejich data
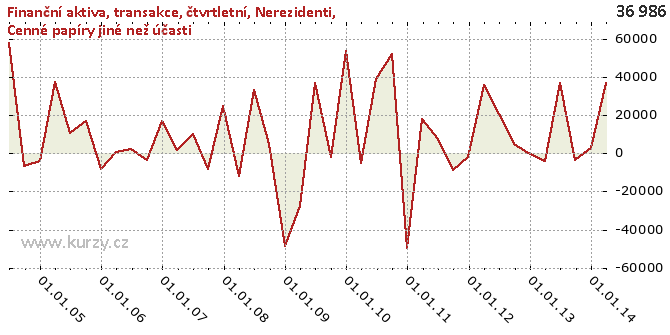
Graf hodnot, Financial assets, transactions, quaterly, Rest of the world
Meziroční srovnání
Minima a maxima
| Typ | Období | Hodnota |
|---|---|---|
| Min | 31.12.2010 | -49 930.00 |
| Max | 30.06.2004 | 58 121.00 |
Historické hodnoty
| Období | Hodnota | Předchozí | Rozdíl | Změna | Před rokem | Rozdíl | Změna |
|---|---|---|---|---|---|---|---|
| 31.03.2014 | 36 986.00 | 2 705.00 | 34 281.00 | 1 267.32% | -3 932.00 | 40 918.00 | -1 040.64% |
| 31.12.2013 | 2 705.00 | -3 583.00 | 6 288.00 | - 175.50% | - 294.00 | 2 999.00 | -1 020.07% |
| 30.09.2013 | -3 583.00 | 37 144.00 | -40 727.00 | - 109.65% | 4 925.00 | -8 508.00 | - 172.75% |
| 30.06.2013 | 37 144.00 | -3 932.00 | 41 076.00 | -1 044.66% | 20 410.00 | 16 734.00 | 81.99% |
| 31.03.2013 | -3 932.00 | - 294.00 | -3 638.00 | 1 237.41% | 35 673.00 | -39 605.00 | - 111.02% |
| 31.12.2012 | - 294.00 | 4 925.00 | -5 219.00 | - 105.97% | -2 074.00 | 1 780.00 | -85.82% |
| 30.09.2012 | 4 925.00 | 20 410.00 | -15 485.00 | -75.87% | -8 589.00 | 13 514.00 | - 157.34% |
| 30.06.2012 | 20 410.00 | 35 673.00 | -15 263.00 | -42.79% | 7 723.00 | 12 687.00 | 164.28% |
| 31.03.2012 | 35 673.00 | -2 074.00 | 37 747.00 | -1 820.01% | 18 042.00 | 17 631.00 | 97.72% |
| 31.12.2011 | -2 074.00 | -8 589.00 | 6 515.00 | -75.85% | -49 930.00 | 47 856.00 | -95.85% |
| 30.09.2011 | -8 589.00 | 7 723.00 | -16 312.00 | - 211.21% | 52 174.00 | -60 763.00 | - 116.46% |
| 30.06.2011 | 7 723.00 | 18 042.00 | -10 319.00 | -57.19% | 39 079.00 | -31 356.00 | -80.24% |
| 31.03.2011 | 18 042.00 | -49 930.00 | 67 972.00 | - 136.13% | -4 916.00 | 22 958.00 | - 467.01% |
| 31.12.2010 | -49 930.00 | 52 174.00 | - 102 104.00 | - 195.70% | 53 698.00 | - 103 628.00 | - 192.98% |
| 30.09.2010 | 52 174.00 | 39 079.00 | 13 095.00 | 33.51% | -1 717.00 | 53 891.00 | -3 138.67% |
| 30.06.2010 | 39 079.00 | -4 916.00 | 43 995.00 | - 894.93% | 36 787.00 | 2 292.00 | 6.23% |
| 31.03.2010 | -4 916.00 | 53 698.00 | -58 614.00 | - 109.15% | -27 656.00 | 22 740.00 | -82.22% |
| 31.12.2009 | 53 698.00 | -1 717.00 | 55 415.00 | -3 227.43% | -48 661.00 | 102 359.00 | - 210.35% |
| 30.09.2009 | -1 717.00 | 36 787.00 | -38 504.00 | - 104.67% | 5 109.00 | -6 826.00 | - 133.61% |
| 30.06.2009 | 36 787.00 | -27 656.00 | 64 443.00 | - 233.02% | 33 116.00 | 3 671.00 | 11.09% |
| 31.03.2009 | -27 656.00 | -48 661.00 | 21 005.00 | -43.17% | -11 672.00 | -15 984.00 | 136.94% |
| 31.12.2008 | -48 661.00 | 5 109.00 | -53 770.00 | -1 052.46% | 24 910.00 | -73 571.00 | - 295.35% |
| 30.09.2008 | 5 109.00 | 33 116.00 | -28 007.00 | -84.57% | -8 457.00 | 13 566.00 | - 160.41% |
| 30.06.2008 | 33 116.00 | -11 672.00 | 44 788.00 | - 383.72% | 10 344.00 | 22 772.00 | 220.15% |
| 31.03.2008 | -11 672.00 | 24 910.00 | -36 582.00 | - 146.86% | 1 591.00 | -13 263.00 | - 833.63% |
| 31.12.2007 | 24 910.00 | -8 457.00 | 33 367.00 | - 394.55% | 16 918.00 | 7 992.00 | 47.24% |
| 30.09.2007 | -8 457.00 | 10 344.00 | -18 801.00 | - 181.76% | -3 659.00 | -4 798.00 | 131.13% |
| 30.06.2007 | 10 344.00 | 1 591.00 | 8 753.00 | 550.16% | 2 068.00 | 8 276.00 | 400.19% |
| 31.03.2007 | 1 591.00 | 16 918.00 | -15 327.00 | -90.60% | 531.00 | 1 060.00 | 199.62% |
| 31.12.2006 | 16 918.00 | -3 659.00 | 20 577.00 | - 562.37% | -8 348.00 | 25 266.00 | - 302.66% |
| 30.09.2006 | -3 659.00 | 2 068.00 | -5 727.00 | - 276.93% | 17 202.00 | -20 861.00 | - 121.27% |
| 30.06.2006 | 2 068.00 | 531.00 | 1 537.00 | 289.45% | 10 779.00 | -8 711.00 | -80.81% |
| 31.03.2006 | 531.00 | -8 348.00 | 8 879.00 | - 106.36% | 37 635.00 | -37 104.00 | -98.59% |
| 31.12.2005 | -8 348.00 | 17 202.00 | -25 550.00 | - 148.53% | -4 301.00 | -4 047.00 | 94.09% |
| 30.09.2005 | 17 202.00 | 10 779.00 | 6 423.00 | 59.59% | -6 758.00 | 23 960.00 | - 354.54% |
| 30.06.2005 | 10 779.00 | 37 635.00 | -26 856.00 | -71.36% | 58 121.00 | -47 342.00 | -81.45% |
| 31.03.2005 | 37 635.00 | -4 301.00 | 41 936.00 | - 975.03% | - | - | - |
| 31.12.2004 | -4 301.00 | -6 758.00 | 2 457.00 | -36.36% | - | - | - |
| 30.09.2004 | -6 758.00 | 58 121.00 | -64 879.00 | - 111.63% | - | - | - |
| 30.06.2004 | 58 121.00 | - | - | - | - | - | - |
Graf jako obrázek

Podobné sestavy
Aplikace Ekonomika ČNB ze sekce makroekonomika zobrazuje časové řady hlavních makroekonomických údajů z ekonomiky ČR. Najdete zde přes 10.000 grafů různých hodnot od úrokových sazeb, přes statistiky státního rozpočtu, statistiky ČNB a data zpracovávaná ČSÚ. Data jsou k dispozici obvykle za posledních více než 20 let, od prosince roku 1992. Zdroj dat: ČNB ARAD

