Volume of securities trades for clients, total - ekonomika ČNB
Aktualizace dat Volume of securities trades for clients, total v této aplikaci skončila 30.6.2023. Aktualizovná data časových řad najdete na stránkách nové aplikace z dat ARAD ČNB
Nové časové řady makroekonomiky a jejich data
Graf hodnot, Investment firms total
Meziroční srovnání
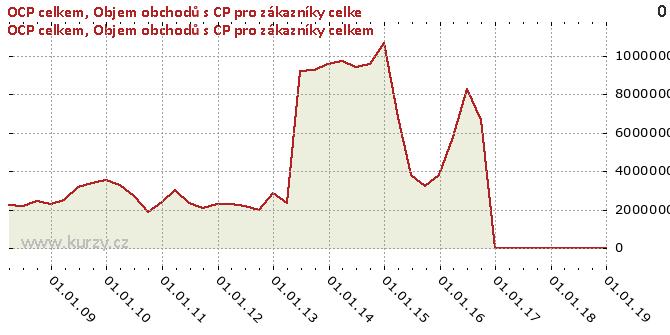
Minima a maxima
| Typ | Období | Hodnota |
|---|---|---|
| Max | 31.12.2014 | 10 674 990.00 |
| Min | 30.09.2010 | 1 865 175.00 |
Historické hodnoty
| Období | Hodnota | Předchozí | Rozdíl | Změna | Před rokem | Rozdíl | Změna |
|---|---|---|---|---|---|---|---|
| 31.12.2018 | 0.00 | 0.00 | 0.00 | - | 0.00 | 0.00 | - |
| 30.09.2018 | 0.00 | 0.00 | 0.00 | - | 0.00 | 0.00 | - |
| 30.06.2018 | 0.00 | 0.00 | 0.00 | - | 0.00 | 0.00 | - |
| 31.03.2018 | 0.00 | 0.00 | 0.00 | - | 0.00 | 0.00 | - |
| 31.12.2017 | 0.00 | 0.00 | 0.00 | - | 0.00 | 0.00 | - |
| 30.09.2017 | 0.00 | 0.00 | 0.00 | - | 6 648 238.00 | -6 648 238.00 | - |
| 30.06.2017 | 0.00 | 0.00 | 0.00 | - | 8 285 887.00 | -8 285 887.00 | - |
| 31.03.2017 | 0.00 | 0.00 | 0.00 | - | 5 770 056.00 | -5 770 056.00 | - |
| 31.12.2016 | 0.00 | 6 648 238.00 | -6 648 238.00 | - | 3 785 667.00 | -3 785 667.00 | - |
| 30.09.2016 | 6 648 238.00 | 8 285 887.00 | -1 637 649.00 | -19.76% | 3 249 373.00 | 3 398 865.00 | 104.60% |
| 30.06.2016 | 8 285 887.00 | 5 770 056.00 | 2 515 831.00 | 43.60% | 3 826 808.00 | 4 459 079.00 | 116.52% |
| 31.03.2016 | 5 770 056.00 | 3 785 667.00 | 1 984 389.00 | 52.42% | 6 837 248.00 | -1 067 192.00 | -15.61% |
| 31.12.2015 | 3 785 667.00 | 3 249 373.00 | 536 294.00 | 16.50% | 10 674 990.00 | -6 889 323.00 | -64.54% |
| 30.09.2015 | 3 249 373.00 | 3 826 808.00 | - 577 435.00 | -15.09% | 9 587 728.00 | -6 338 355.00 | -66.11% |
| 30.06.2015 | 3 826 808.00 | 6 837 248.00 | -3 010 440.00 | -44.03% | 9 414 963.00 | -5 588 155.00 | -59.35% |
| 31.03.2015 | 6 837 248.00 | 10 674 990.00 | -3 837 742.00 | -35.95% | 9 728 529.00 | -2 891 281.00 | -29.72% |
| 31.12.2014 | 10 674 990.00 | 9 587 728.00 | 1 087 262.00 | 11.34% | 9 586 701.00 | 1 088 289.00 | 11.35% |
| 30.09.2014 | 9 587 728.00 | 9 414 963.00 | 172 765.00 | 1.83% | 9 278 416.00 | 309 312.00 | 3.33% |
| 30.06.2014 | 9 414 963.00 | 9 728 529.00 | - 313 566.00 | -3.22% | 9 189 168.00 | 225 795.00 | 2.46% |
| 31.03.2014 | 9 728 529.00 | 9 586 701.00 | 141 828.00 | 1.48% | 2 354 402.00 | 7 374 127.00 | 313.21% |
| 31.12.2013 | 9 586 701.00 | 9 278 416.00 | 308 285.00 | 3.32% | 2 861 392.00 | 6 725 309.00 | 235.04% |
| 30.09.2013 | 9 278 416.00 | 9 189 168.00 | 89 248.00 | 0.97% | 1 987 824.00 | 7 290 592.00 | 366.76% |
| 30.06.2013 | 9 189 168.00 | 2 354 402.00 | 6 834 766.00 | 290.30% | 2 183 311.00 | 7 005 857.00 | 320.88% |
| 31.03.2013 | 2 354 402.00 | 2 861 392.00 | - 506 990.00 | -17.72% | 2 313 829.00 | 40 573.00 | 1.75% |
| 31.12.2012 | 2 861 392.00 | 1 987 824.00 | 873 568.00 | 43.95% | 2 308 715.00 | 552 677.00 | 23.94% |
| 30.09.2012 | 1 987 824.00 | 2 183 311.00 | - 195 487.00 | -8.95% | 2 072 921.00 | -85 097.00 | -4.11% |
| 30.06.2012 | 2 183 311.00 | 2 313 829.00 | - 130 518.00 | -5.64% | 2 348 747.00 | - 165 436.00 | -7.04% |
| 31.03.2012 | 2 313 829.00 | 2 308 715.00 | 5 114.00 | 0.22% | 3 049 652.00 | - 735 823.00 | -24.13% |
| 31.12.2011 | 2 308 715.00 | 2 072 921.00 | 235 794.00 | 11.37% | 2 431 367.00 | - 122 652.00 | -5.04% |
| 30.09.2011 | 2 072 921.00 | 2 348 747.00 | - 275 826.00 | -11.74% | 1 865 175.00 | 207 746.00 | 11.14% |
| 30.06.2011 | 2 348 747.00 | 3 049 652.00 | - 700 905.00 | -22.98% | 2 733 925.00 | - 385 178.00 | -14.09% |
| 31.03.2011 | 3 049 652.00 | 2 431 367.00 | 618 285.00 | 25.43% | 3 286 647.00 | - 236 995.00 | -7.21% |
| 31.12.2010 | 2 431 367.00 | 1 865 175.00 | 566 192.00 | 30.36% | 3 556 925.00 | -1 125 558.00 | -31.64% |
| 30.09.2010 | 1 865 175.00 | 2 733 925.00 | - 868 750.00 | -31.78% | 3 395 592.00 | -1 530 417.00 | -45.07% |
| 30.06.2010 | 2 733 925.00 | 3 286 647.00 | - 552 722.00 | -16.82% | 3 196 405.00 | - 462 480.00 | -14.47% |
| 31.03.2010 | 3 286 647.00 | 3 556 925.00 | - 270 278.00 | -7.60% | 2 492 497.00 | 794 150.00 | 31.86% |
| 31.12.2009 | 3 556 925.00 | 3 395 592.00 | 161 333.00 | 4.75% | 2 286 908.00 | 1 270 017.00 | 55.53% |
| 30.09.2009 | 3 395 592.00 | 3 196 405.00 | 199 187.00 | 6.23% | 2 476 533.00 | 919 059.00 | 37.11% |
| 30.06.2009 | 3 196 405.00 | 2 492 497.00 | 703 908.00 | 28.24% | 2 216 383.00 | 980 022.00 | 44.22% |
| 31.03.2009 | 2 492 497.00 | 2 286 908.00 | 205 589.00 | 8.99% | 2 257 285.00 | 235 212.00 | 10.42% |
| 31.12.2008 | 2 286 908.00 | 2 476 533.00 | - 189 625.00 | -7.66% | - | - | - |
| 30.09.2008 | 2 476 533.00 | 2 216 383.00 | 260 150.00 | 11.74% | - | - | - |
| 30.06.2008 | 2 216 383.00 | 2 257 285.00 | -40 902.00 | -1.81% | - | - | - |
| 31.03.2008 | 2 257 285.00 | - | - | - | - | - | - |
Graf jako obrázek

Podobné sestavy
Aplikace Ekonomika ČNB ze sekce makroekonomika zobrazuje časové řady hlavních makroekonomických údajů z ekonomiky ČR. Najdete zde přes 10.000 grafů různých hodnot od úrokových sazeb, přes statistiky státního rozpočtu, statistiky ČNB a data zpracovávaná ČSÚ. Data jsou k dispozici obvykle za posledních více než 20 let, od prosince roku 1992. Zdroj dat: ČNB ARAD

