Financial assets at fair value through other comprehensive income - ekonomika ČNB
Aktualizace dat Financial assets at fair value through other comprehensive income v této aplikaci skončila 30.6.2023. Aktualizovná data časových řad najdete na stránkách nové aplikace z dat ARAD ČNB
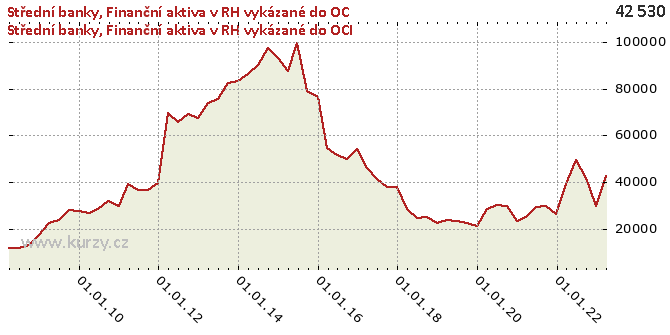
Graf hodnot, Medium-sized banks
Meziroční srovnání
Minima a maxima
| Typ | Období | Hodnota |
|---|---|---|
| Max | 30.06.2015 | 99 695.00 |
| Min | 30.06.2008 | 11 596.00 |
Historické hodnoty
| Období | Hodnota | Předchozí | Rozdíl | Změna | Před rokem | Rozdíl | Změna |
|---|---|---|---|---|---|---|---|
| 31.03.2020 | 28 555.00 | 21 403.00 | 7 152.00 | 33.42% | 23 847.00 | 4 708.00 | 19.74% |
| 31.12.2019 | 21 403.00 | 22 420.00 | -1 017.00 | -4.54% | 22 655.00 | -1 252.00 | -5.53% |
| 30.09.2019 | 22 420.00 | 23 517.00 | -1 097.00 | -4.66% | 25 011.00 | -2 591.00 | -10.36% |
| 30.06.2019 | 23 517.00 | 23 847.00 | - 330.00 | -1.38% | 24 805.00 | -1 288.00 | -5.19% |
| 31.03.2019 | 23 847.00 | 22 655.00 | 1 192.00 | 5.26% | 28 399.00 | -4 552.00 | -16.03% |
| 31.12.2018 | 22 655.00 | 25 011.00 | -2 356.00 | -9.42% | 38 087.00 | -15 432.00 | -40.52% |
| 30.09.2018 | 25 011.00 | 24 805.00 | 206.00 | 0.83% | 37 909.00 | -12 898.00 | -34.02% |
| 30.06.2018 | 24 805.00 | 28 399.00 | -3 594.00 | -12.66% | 41 437.00 | -16 632.00 | -40.14% |
| 31.03.2018 | 28 399.00 | 38 087.00 | -9 688.00 | -25.44% | 45 835.00 | -17 436.00 | -38.04% |
| 31.12.2017 | 38 087.00 | 37 909.00 | 178.00 | 0.47% | 53 950.00 | -15 863.00 | -29.40% |
| 30.09.2017 | 37 909.00 | 41 437.00 | -3 528.00 | -8.51% | 49 773.00 | -11 864.00 | -23.84% |
| 30.06.2017 | 41 437.00 | 45 835.00 | -4 398.00 | -9.60% | 51 787.00 | -10 350.00 | -19.99% |
| 31.03.2017 | 45 835.00 | 53 950.00 | -8 115.00 | -15.04% | 54 599.00 | -8 764.00 | -16.05% |
| 31.12.2016 | 53 950.00 | 49 773.00 | 4 177.00 | 8.39% | 76 250.00 | -22 300.00 | -29.25% |
| 30.09.2016 | 49 773.00 | 51 787.00 | -2 014.00 | -3.89% | 78 772.00 | -28 999.00 | -36.81% |
| 30.06.2016 | 51 787.00 | 54 599.00 | -2 812.00 | -5.15% | 99 695.00 | -47 908.00 | -48.05% |
| 31.03.2016 | 54 599.00 | 76 250.00 | -21 651.00 | -28.39% | 87 542.00 | -32 943.00 | -37.63% |
| 31.12.2015 | 76 250.00 | 78 772.00 | -2 522.00 | -3.20% | 93 292.00 | -17 042.00 | -18.27% |
| 30.09.2015 | 78 772.00 | 99 695.00 | -20 923.00 | -20.99% | 97 303.00 | -18 531.00 | -19.04% |
| 30.06.2015 | 99 695.00 | 87 542.00 | 12 153.00 | 13.88% | 90 243.00 | 9 452.00 | 10.47% |
| 31.03.2015 | 87 542.00 | 93 292.00 | -5 750.00 | -6.16% | 86 295.00 | 1 247.00 | 1.45% |
| 31.12.2014 | 93 292.00 | 97 303.00 | -4 011.00 | -4.12% | 83 453.00 | 9 839.00 | 11.79% |
| 30.09.2014 | 97 303.00 | 90 243.00 | 7 060.00 | 7.82% | 82 370.00 | 14 933.00 | 18.13% |
| 30.06.2014 | 90 243.00 | 86 295.00 | 3 948.00 | 4.58% | 75 445.00 | 14 798.00 | 19.61% |
| 31.03.2014 | 86 295.00 | 83 453.00 | 2 842.00 | 3.41% | 73 801.00 | 12 494.00 | 16.93% |
| 31.12.2013 | 83 453.00 | 82 370.00 | 1 083.00 | 1.31% | 67 340.00 | 16 113.00 | 23.93% |
| 30.09.2013 | 82 370.00 | 75 445.00 | 6 925.00 | 9.18% | 69 177.00 | 13 193.00 | 19.07% |
| 30.06.2013 | 75 445.00 | 73 801.00 | 1 644.00 | 2.23% | 65 593.00 | 9 852.00 | 15.02% |
| 31.03.2013 | 73 801.00 | 67 340.00 | 6 461.00 | 9.59% | 69 751.00 | 4 050.00 | 5.81% |
| 31.12.2012 | 67 340.00 | 69 177.00 | -1 837.00 | -2.66% | 39 783.00 | 27 557.00 | 69.27% |
| 30.09.2012 | 69 177.00 | 65 593.00 | 3 584.00 | 5.46% | 36 643.00 | 32 534.00 | 88.79% |
| 30.06.2012 | 65 593.00 | 69 751.00 | -4 158.00 | -5.96% | 36 391.00 | 29 202.00 | 80.25% |
| 31.03.2012 | 69 751.00 | 39 783.00 | 29 968.00 | 75.33% | 39 069.00 | 30 682.00 | 78.53% |
| 31.12.2011 | 39 783.00 | 36 643.00 | 3 140.00 | 8.57% | 29 552.00 | 10 231.00 | 34.62% |
| 30.09.2011 | 36 643.00 | 36 391.00 | 252.00 | 0.69% | 31 733.00 | 4 910.00 | 15.47% |
| 30.06.2011 | 36 391.00 | 39 069.00 | -2 678.00 | -6.85% | 28 399.00 | 7 992.00 | 28.14% |
| 31.03.2011 | 39 069.00 | 29 552.00 | 9 517.00 | 32.20% | 26 714.00 | 12 355.00 | 46.25% |
| 31.12.2010 | 29 552.00 | 31 733.00 | -2 181.00 | -6.87% | 27 570.00 | 1 982.00 | 7.19% |
| 30.09.2010 | 31 733.00 | 28 399.00 | 3 334.00 | 11.74% | 28 123.00 | 3 610.00 | 12.84% |
| 30.06.2010 | 28 399.00 | 26 714.00 | 1 685.00 | 6.31% | 23 678.00 | 4 721.00 | 19.94% |
| 31.03.2010 | 26 714.00 | 27 570.00 | - 856.00 | -3.10% | 22 566.00 | 4 148.00 | 18.38% |
| 31.12.2009 | 27 570.00 | 28 123.00 | - 553.00 | -1.97% | 17 308.00 | 10 262.00 | 59.29% |
| 30.09.2009 | 28 123.00 | 23 678.00 | 4 445.00 | 18.77% | 13 249.00 | 14 874.00 | 112.27% |
| 30.06.2009 | 23 678.00 | 22 566.00 | 1 112.00 | 4.93% | 11 596.00 | 12 082.00 | 104.19% |
| 31.03.2009 | 22 566.00 | 17 308.00 | 5 258.00 | 30.38% | 11 702.00 | 10 864.00 | 92.84% |
| 31.12.2008 | 17 308.00 | 13 249.00 | 4 059.00 | 30.64% | - | - | - |
| 30.09.2008 | 13 249.00 | 11 596.00 | 1 653.00 | 14.25% | - | - | - |
| 30.06.2008 | 11 596.00 | 11 702.00 | - 106.00 | -0.91% | - | - | - |
| 31.03.2008 | 11 702.00 | - | - | - | - | - | - |
Graf jako obrázek

Podobné sestavy
Aplikace Ekonomika ČNB ze sekce makroekonomika zobrazuje časové řady hlavních makroekonomických údajů z ekonomiky ČR. Najdete zde přes 10.000 grafů různých hodnot od úrokových sazeb, přes statistiky státního rozpočtu, statistiky ČNB a data zpracovávaná ČSÚ. Data jsou k dispozici obvykle za posledních více než 20 let, od prosince roku 1992. Zdroj dat: ČNB ARAD

