Investment fund shares/units (Mixed Funds Balance Sheet) - ekonomika ČNB
Aktualizace dat Investment fund shares/units (Mixed Funds Balance Sheet) v této aplikaci skončila 30.6.2023. Aktualizovná data časových řad najdete na stránkách nové aplikace z dat ARAD ČNB
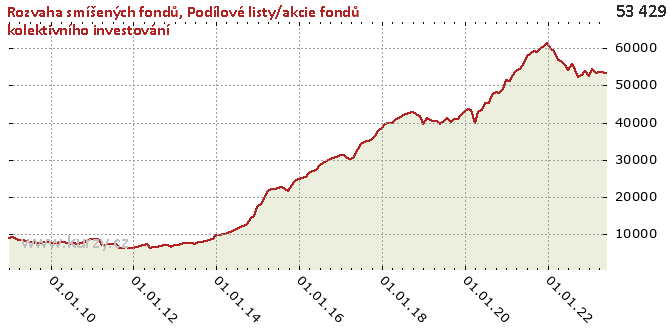
Graf hodnot, Mixed Funds Balance Sheet
Meziroční srovnání
Minima a maxima
| Typ | Období | Hodnota |
|---|---|---|
| Max | 30.06.2020 | 45 193.79 |
| Min | 30.11.2011 | 5 997.75 |
Historické hodnoty
| Období | Hodnota | Předchozí | Rozdíl | Změna | Před rokem | Rozdíl | Změna |
|---|---|---|---|---|---|---|---|
| 30.06.2020 | 45 193.79 | 43 297.80 | 1 895.99 | 4.38% | 40 375.26 | 4 818.53 | 11.93% |
| 31.05.2020 | 43 297.80 | 42 691.69 | 606.11 | 1.42% | 39 531.55 | 3 766.25 | 9.53% |
| 30.04.2020 | 42 691.69 | 39 695.05 | 2 996.64 | 7.55% | 40 440.49 | 2 251.20 | 5.57% |
| 31.03.2020 | 39 695.05 | 43 318.23 | -3 623.18 | -8.36% | 40 481.96 | - 786.90 | -1.94% |
| 29.02.2020 | 43 318.23 | 43 562.34 | - 244.11 | -0.56% | 40 701.28 | 2 616.95 | 6.43% |
| 31.01.2020 | 43 562.34 | 43 068.95 | 493.39 | 1.15% | 41 135.75 | 2 426.59 | 5.90% |
| 31.12.2019 | 43 068.95 | 41 934.76 | 1 134.19 | 2.70% | 39 634.24 | 3 434.72 | 8.67% |
| 30.11.2019 | 41 934.76 | 41 004.88 | 929.88 | 2.27% | 41 868.19 | 66.57 | 0.16% |
| 31.10.2019 | 41 004.88 | 40 817.64 | 187.25 | 0.46% | 42 318.10 | -1 313.22 | -3.10% |
| 30.09.2019 | 40 817.64 | 40 082.30 | 735.34 | 1.83% | 42 787.18 | -1 969.54 | -4.60% |
| 31.08.2019 | 40 082.30 | 41 304.67 | -1 222.36 | -2.96% | 42 661.54 | -2 579.23 | -6.05% |
| 31.07.2019 | 41 304.67 | 40 375.26 | 929.40 | 2.30% | 42 333.65 | -1 028.99 | -2.43% |
| 30.06.2019 | 40 375.26 | 39 531.55 | 843.71 | 2.13% | 41 633.20 | -1 257.94 | -3.02% |
| 31.05.2019 | 39 531.55 | 40 440.49 | - 908.93 | -2.25% | 41 126.19 | -1 594.64 | -3.88% |
| 30.04.2019 | 40 440.49 | 40 481.96 | -41.47 | -0.10% | 40 660.91 | - 220.42 | -0.54% |
| 31.03.2019 | 40 481.96 | 40 701.28 | - 219.32 | -0.54% | 39 798.18 | 683.77 | 1.72% |
| 28.02.2019 | 40 701.28 | 41 135.75 | - 434.47 | -1.06% | 39 954.89 | 746.38 | 1.87% |
| 31.01.2019 | 41 135.75 | 39 634.24 | 1 501.51 | 3.79% | 39 511.72 | 1 624.03 | 4.11% |
| 31.12.2018 | 39 634.24 | 41 868.19 | -2 233.95 | -5.34% | 38 449.01 | 1 185.23 | 3.08% |
| 30.11.2018 | 41 868.19 | 42 318.10 | - 449.91 | -1.06% | 37 680.12 | 4 188.07 | 11.11% |
| 31.10.2018 | 42 318.10 | 42 787.18 | - 469.08 | -1.10% | 36 384.96 | 5 933.14 | 16.31% |
| 30.09.2018 | 42 787.18 | 42 661.54 | 125.64 | 0.29% | 35 230.31 | 7 556.86 | 21.45% |
| 31.08.2018 | 42 661.54 | 42 333.65 | 327.88 | 0.77% | 35 067.25 | 7 594.29 | 21.66% |
| 31.07.2018 | 42 333.65 | 41 633.20 | 700.45 | 1.68% | 34 836.85 | 7 496.80 | 21.52% |
| 30.06.2018 | 41 633.20 | 41 126.19 | 507.01 | 1.23% | 34 204.53 | 7 428.67 | 21.72% |
| 31.05.2018 | 41 126.19 | 40 660.91 | 465.28 | 1.14% | 32 833.40 | 8 292.79 | 25.26% |
| 30.04.2018 | 40 660.91 | 39 798.18 | 862.73 | 2.17% | 30 592.09 | 10 068.82 | 32.91% |
| 31.03.2018 | 39 798.18 | 39 954.89 | - 156.71 | -0.39% | 30 133.56 | 9 664.62 | 32.07% |
| 28.02.2018 | 39 954.89 | 39 511.72 | 443.18 | 1.12% | 30 475.96 | 9 478.93 | 31.10% |
| 31.01.2018 | 39 511.72 | 38 449.01 | 1 062.71 | 2.76% | 31 302.84 | 8 208.88 | 26.22% |
| 31.12.2017 | 38 449.01 | 37 680.12 | 768.89 | 2.04% | 31 243.29 | 7 205.72 | 23.06% |
| 30.11.2017 | 37 680.12 | 36 384.96 | 1 295.16 | 3.56% | 30 705.85 | 6 974.27 | 22.71% |
| 31.10.2017 | 36 384.96 | 35 230.31 | 1 154.64 | 3.28% | 30 414.79 | 5 970.16 | 19.63% |
| 30.09.2017 | 35 230.31 | 35 067.25 | 163.06 | 0.47% | 30 053.64 | 5 176.67 | 17.22% |
| 31.08.2017 | 35 067.25 | 34 836.85 | 230.40 | 0.66% | 29 694.26 | 5 372.99 | 18.09% |
| 31.07.2017 | 34 836.85 | 34 204.53 | 632.32 | 1.85% | 29 124.37 | 5 712.49 | 19.61% |
| 30.06.2017 | 34 204.53 | 32 833.40 | 1 371.13 | 4.18% | 28 401.84 | 5 802.69 | 20.43% |
| 31.05.2017 | 32 833.40 | 30 592.09 | 2 241.31 | 7.33% | 27 267.48 | 5 565.92 | 20.41% |
| 30.04.2017 | 30 592.09 | 30 133.56 | 458.52 | 1.52% | 26 926.56 | 3 665.53 | 13.61% |
| 31.03.2017 | 30 133.56 | 30 475.96 | - 342.40 | -1.12% | 26 274.55 | 3 859.01 | 14.69% |
| 28.02.2017 | 30 475.96 | 31 302.84 | - 826.88 | -2.64% | 25 175.09 | 5 300.88 | 21.06% |
| 31.01.2017 | 31 302.84 | 31 243.29 | 59.55 | 0.19% | 24 950.65 | 6 352.19 | 25.46% |
| 31.12.2016 | 31 243.29 | 30 705.85 | 537.44 | 1.75% | 24 781.79 | 6 461.49 | 26.07% |
| 30.11.2016 | 30 705.85 | 30 414.79 | 291.06 | 0.96% | 24 106.37 | 6 599.48 | 27.38% |
| 31.10.2016 | 30 414.79 | 30 053.64 | 361.15 | 1.20% | 23 074.93 | 7 339.86 | 31.81% |
| 30.09.2016 | 30 053.64 | 29 694.26 | 359.38 | 1.21% | 21 405.12 | 8 648.52 | 40.40% |
| 31.08.2016 | 29 694.26 | 29 124.37 | 569.90 | 1.96% | 21 952.82 | 7 741.44 | 35.26% |
| 31.07.2016 | 29 124.37 | 28 401.84 | 722.53 | 2.54% | 22 692.26 | 6 432.10 | 28.34% |
| 30.06.2016 | 28 401.84 | 27 267.48 | 1 134.36 | 4.16% | 22 261.71 | 6 140.13 | 27.58% |
| 31.05.2016 | 27 267.48 | 26 926.56 | 340.92 | 1.27% | 22 172.24 | 5 095.24 | 22.98% |
| 30.04.2016 | 26 926.56 | 26 274.55 | 652.00 | 2.48% | 21 980.04 | 4 946.52 | 22.50% |
| 31.03.2016 | 26 274.55 | 25 175.09 | 1 099.46 | 4.37% | 21 450.05 | 4 824.50 | 22.49% |
| 29.02.2016 | 25 175.09 | 24 950.65 | 224.44 | 0.90% | 19 381.09 | 5 794.00 | 29.90% |
| 31.01.2016 | 24 950.65 | 24 781.79 | 168.86 | 0.68% | 17 920.60 | 7 030.05 | 39.23% |
| 31.12.2015 | 24 781.79 | 24 106.37 | 675.42 | 2.80% | 17 096.01 | 7 685.78 | 44.96% |
| 30.11.2015 | 24 106.37 | 23 074.93 | 1 031.44 | 4.47% | 14 707.20 | 9 399.17 | 63.91% |
| 31.10.2015 | 23 074.93 | 21 405.12 | 1 669.81 | 7.80% | 14 207.77 | 8 867.16 | 62.41% |
| 30.09.2015 | 21 405.12 | 21 952.82 | - 547.70 | -2.49% | 12 584.37 | 8 820.75 | 70.09% |
| 31.08.2015 | 21 952.82 | 22 692.26 | - 739.44 | -3.26% | 12 166.30 | 9 786.52 | 80.44% |
| 31.07.2015 | 22 692.26 | 22 261.71 | 430.55 | 1.93% | 11 669.13 | 11 023.13 | 94.46% |
| 30.06.2015 | 22 261.71 | 22 172.24 | 89.47 | 0.40% | 11 359.71 | 10 902.00 | 95.97% |
| 31.05.2015 | 22 172.24 | 21 980.04 | 192.20 | 0.87% | 10 748.57 | 11 423.67 | 106.28% |
| 30.04.2015 | 21 980.04 | 21 450.05 | 529.99 | 2.47% | 10 420.89 | 11 559.15 | 110.92% |
| 31.03.2015 | 21 450.05 | 19 381.09 | 2 068.96 | 10.68% | 9 978.32 | 11 471.73 | 114.97% |
| 28.02.2015 | 19 381.09 | 17 920.60 | 1 460.49 | 8.15% | 9 843.50 | 9 537.59 | 96.89% |
| 31.01.2015 | 17 920.60 | 17 096.01 | 824.59 | 4.82% | 9 530.85 | 8 389.74 | 88.03% |
| 31.12.2014 | 17 096.01 | 14 707.20 | 2 388.81 | 16.24% | 9 583.51 | 7 512.49 | 78.39% |
| 30.11.2014 | 14 707.20 | 14 207.77 | 499.43 | 3.52% | 8 456.28 | 6 250.93 | 73.92% |
| 31.10.2014 | 14 207.77 | 12 584.37 | 1 623.40 | 12.90% | 8 221.55 | 5 986.22 | 72.81% |
| 30.09.2014 | 12 584.37 | 12 166.30 | 418.07 | 3.44% | 7 922.69 | 4 661.67 | 58.84% |
| 31.08.2014 | 12 166.30 | 11 669.13 | 497.16 | 4.26% | 7 733.81 | 4 432.48 | 57.31% |
| 31.07.2014 | 11 669.13 | 11 359.71 | 309.42 | 2.72% | 7 691.56 | 3 977.57 | 51.71% |
| 30.06.2014 | 11 359.71 | 10 748.57 | 611.14 | 5.69% | 7 227.20 | 4 132.51 | 57.18% |
| 31.05.2014 | 10 748.57 | 10 420.89 | 327.68 | 3.14% | 7 575.99 | 3 172.57 | 41.88% |
| 30.04.2014 | 10 420.89 | 9 978.32 | 442.57 | 4.44% | 7 481.63 | 2 939.26 | 39.29% |
| 31.03.2014 | 9 978.32 | 9 843.50 | 134.81 | 1.37% | 7 373.44 | 2 604.88 | 35.33% |
| 28.02.2014 | 9 843.50 | 9 530.85 | 312.65 | 3.28% | 7 133.18 | 2 710.32 | 38.00% |
| 31.01.2014 | 9 530.85 | 9 583.51 | -52.66 | -0.55% | 6 953.35 | 2 577.51 | 37.07% |
| 31.12.2013 | 9 583.51 | 8 456.28 | 1 127.24 | 13.33% | 6 805.52 | 2 777.99 | 40.82% |
| 30.11.2013 | 8 456.28 | 8 221.55 | 234.73 | 2.85% | 6 443.95 | 2 012.33 | 31.23% |
| 31.10.2013 | 8 221.55 | 7 922.69 | 298.85 | 3.77% | 6 850.71 | 1 370.84 | 20.01% |
| 30.09.2013 | 7 922.69 | 7 733.81 | 188.88 | 2.44% | 6 981.81 | 940.88 | 13.48% |
| 31.08.2013 | 7 733.81 | 7 691.56 | 42.25 | 0.55% | 6 730.07 | 1 003.74 | 14.91% |
| 31.07.2013 | 7 691.56 | 7 227.20 | 464.36 | 6.43% | 6 508.61 | 1 182.95 | 18.18% |
| 30.06.2013 | 7 227.20 | 7 575.99 | - 348.79 | -4.60% | 6 275.85 | 951.35 | 15.16% |
| 31.05.2013 | 7 575.99 | 7 481.63 | 94.36 | 1.26% | 6 240.48 | 1 335.51 | 21.40% |
| 30.04.2013 | 7 481.63 | 7 373.44 | 108.19 | 1.47% | 7 065.47 | 416.16 | 5.89% |
| 31.03.2013 | 7 373.44 | 7 133.18 | 240.26 | 3.37% | 6 937.87 | 435.57 | 6.28% |
| 28.02.2013 | 7 133.18 | 6 953.35 | 179.83 | 2.59% | 6 684.74 | 448.44 | 6.71% |
| 31.01.2013 | 6 953.35 | 6 805.52 | 147.83 | 2.17% | 6 495.28 | 458.07 | 7.05% |
| 31.12.2012 | 6 805.52 | 6 443.95 | 361.57 | 5.61% | 6 191.51 | 614.01 | 9.92% |
| 30.11.2012 | 6 443.95 | 6 850.71 | - 406.76 | -5.94% | 5 997.75 | 446.19 | 7.44% |
| 31.10.2012 | 6 850.71 | 6 981.81 | - 131.11 | -1.88% | 6 472.88 | 377.82 | 5.84% |
| 30.09.2012 | 6 981.81 | 6 730.07 | 251.74 | 3.74% | 6 160.28 | 821.54 | 13.34% |
| 31.08.2012 | 6 730.07 | 6 508.61 | 221.46 | 3.40% | 6 240.91 | 489.16 | 7.84% |
| 31.07.2012 | 6 508.61 | 6 275.85 | 232.76 | 3.71% | 7 172.46 | - 663.85 | -9.26% |
| 30.06.2012 | 6 275.85 | 6 240.48 | 35.37 | 0.57% | 7 262.88 | - 987.03 | -13.59% |
| 31.05.2012 | 6 240.48 | 7 065.47 | - 824.99 | -11.68% | 7 200.00 | - 959.52 | -13.33% |
| 30.04.2012 | 7 065.47 | 6 937.87 | 127.60 | 1.84% | 7 019.63 | 45.84 | 0.65% |
| 31.03.2012 | 6 937.87 | 6 684.74 | 253.14 | 3.79% | 7 033.92 | -96.05 | -1.37% |
| 29.02.2012 | 6 684.74 | 6 495.28 | 189.46 | 2.92% | 8 629.80 | -1 945.07 | -22.54% |
| 31.01.2012 | 6 495.28 | 6 191.51 | 303.77 | 4.91% | 8 437.62 | -1 942.35 | -23.02% |
| 31.12.2011 | 6 191.51 | 5 997.75 | 193.75 | 3.23% | 8 514.55 | -2 323.05 | -27.28% |
| 30.11.2011 | 5 997.75 | 6 472.88 | - 475.13 | -7.34% | 8 138.16 | -2 140.41 | -26.30% |
| 31.10.2011 | 6 472.88 | 6 160.28 | 312.60 | 5.07% | 7 804.58 | -1 331.69 | -17.06% |
| 30.09.2011 | 6 160.28 | 6 240.91 | -80.63 | -1.29% | 7 449.21 | -1 288.93 | -17.30% |
| 31.08.2011 | 6 240.91 | 7 172.46 | - 931.55 | -12.99% | 7 317.31 | -1 076.40 | -14.71% |
| 31.07.2011 | 7 172.46 | 7 262.88 | -90.42 | -1.24% | 7 330.89 | - 158.43 | -2.16% |
| 30.06.2011 | 7 262.88 | 7 200.00 | 62.88 | 0.87% | 7 293.20 | -30.32 | -0.42% |
| 31.05.2011 | 7 200.00 | 7 019.63 | 180.37 | 2.57% | 7 517.39 | - 317.38 | -4.22% |
| 30.04.2011 | 7 019.63 | 7 033.92 | -14.29 | -0.20% | 7 789.09 | - 769.46 | -9.88% |
| 31.03.2011 | 7 033.92 | 8 629.80 | -1 595.89 | -18.49% | 7 598.15 | - 564.23 | -7.43% |
| 28.02.2011 | 8 629.80 | 8 437.62 | 192.18 | 2.28% | 7 432.66 | 1 197.14 | 16.11% |
| 31.01.2011 | 8 437.62 | 8 514.55 | -76.93 | -0.90% | 7 579.10 | 858.52 | 11.33% |
| 31.12.2010 | 8 514.55 | 8 138.16 | 376.39 | 4.62% | 7 620.38 | 894.17 | 11.73% |
| 30.11.2010 | 8 138.16 | 7 804.58 | 333.58 | 4.27% | 7 751.43 | 386.73 | 4.99% |
| 31.10.2010 | 7 804.58 | 7 449.21 | 355.37 | 4.77% | 7 668.77 | 135.81 | 1.77% |
| 30.09.2010 | 7 449.21 | 7 317.31 | 131.91 | 1.80% | 7 490.56 | -41.35 | -0.55% |
| 31.08.2010 | 7 317.31 | 7 330.89 | -13.59 | -0.19% | 7 537.84 | - 220.53 | -2.93% |
| 31.07.2010 | 7 330.89 | 7 293.20 | 37.70 | 0.52% | 7 787.13 | - 456.24 | -5.86% |
| 30.06.2010 | 7 293.20 | 7 517.39 | - 224.19 | -2.98% | 7 675.34 | - 382.15 | -4.98% |
| 31.05.2010 | 7 517.39 | 7 789.09 | - 271.70 | -3.49% | 8 035.23 | - 517.84 | -6.44% |
| 30.04.2010 | 7 789.09 | 7 598.15 | 190.94 | 2.51% | 8 140.35 | - 351.26 | -4.32% |
| 31.03.2010 | 7 598.15 | 7 432.66 | 165.49 | 2.23% | 8 169.31 | - 571.15 | -6.99% |
| 28.02.2010 | 7 432.66 | 7 579.10 | - 146.44 | -1.93% | 8 549.33 | -1 116.66 | -13.06% |
| 31.01.2010 | 7 579.10 | 7 620.38 | -41.27 | -0.54% | 8 951.27 | -1 372.17 | -15.33% |
| 31.12.2009 | 7 620.38 | 7 751.43 | - 131.05 | -1.69% | 8 815.46 | -1 195.08 | -13.56% |
| 30.11.2009 | 7 751.43 | 7 668.77 | 82.66 | 1.08% | - | - | - |
| 31.10.2009 | 7 668.77 | 7 490.56 | 178.21 | 2.38% | - | - | - |
| 30.09.2009 | 7 490.56 | 7 537.84 | -47.28 | -0.63% | - | - | - |
| 31.08.2009 | 7 537.84 | 7 787.13 | - 249.29 | -3.20% | - | - | - |
| 31.07.2009 | 7 787.13 | 7 675.34 | 111.78 | 1.46% | - | - | - |
| 30.06.2009 | 7 675.34 | 8 035.23 | - 359.88 | -4.48% | - | - | - |
| 31.05.2009 | 8 035.23 | 8 140.35 | - 105.12 | -1.29% | - | - | - |
| 30.04.2009 | 8 140.35 | 8 169.31 | -28.95 | -0.35% | - | - | - |
| 31.03.2009 | 8 169.31 | 8 549.33 | - 380.02 | -4.45% | - | - | - |
| 28.02.2009 | 8 549.33 | 8 951.27 | - 401.95 | -4.49% | - | - | - |
| 31.01.2009 | 8 951.27 | 8 815.46 | 135.81 | 1.54% | - | - | - |
| 31.12.2008 | 8 815.46 | - | - | - | - | - | - |
Graf jako obrázek

Podobné sestavy
Aplikace Ekonomika ČNB ze sekce makroekonomika zobrazuje časové řady hlavních makroekonomických údajů z ekonomiky ČR. Najdete zde přes 10.000 grafů různých hodnot od úrokových sazeb, přes statistiky státního rozpočtu, statistiky ČNB a data zpracovávaná ČSÚ. Data jsou k dispozici obvykle za posledních více než 20 let, od prosince roku 1992. Zdroj dat: ČNB ARAD

