Investment fund shares/units (Other Funds Balance Sheet) - ekonomika ČNB
Aktualizace dat Investment fund shares/units (Other Funds Balance Sheet) v této aplikaci skončila 30.6.2023. Aktualizovná data časových řad najdete na stránkách nové aplikace z dat ARAD ČNB
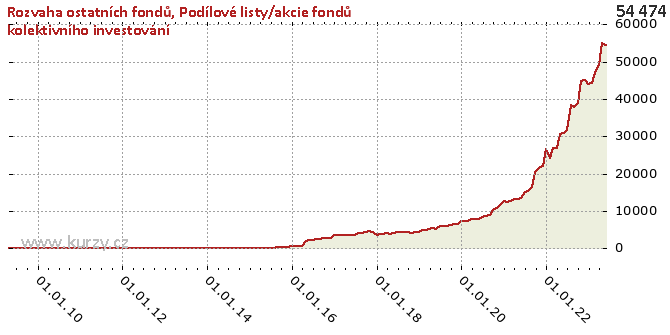
Graf hodnot, Other Funds Balance Sheet
Meziroční srovnání
Minima a maxima
| Typ | Období | Hodnota |
|---|---|---|
| Max | 30.06.2020 | 8 144.31 |
| Min | 30.06.2012 | 4.75 |
Historické hodnoty
| Období | Hodnota | Předchozí | Rozdíl | Změna | Před rokem | Rozdíl | Změna |
|---|---|---|---|---|---|---|---|
| 30.06.2020 | 8 144.31 | 7 942.08 | 202.23 | 2.55% | 5 992.17 | 2 152.14 | 35.92% |
| 31.05.2020 | 7 942.08 | 7 562.61 | 379.47 | 5.02% | 5 331.14 | 2 610.94 | 48.98% |
| 30.04.2020 | 7 562.61 | 7 689.52 | - 126.91 | -1.65% | 5 453.91 | 2 108.70 | 38.66% |
| 31.03.2020 | 7 689.52 | 7 154.13 | 535.39 | 7.48% | 5 223.82 | 2 465.71 | 47.20% |
| 29.02.2020 | 7 154.13 | 6 899.04 | 255.09 | 3.70% | 4 916.51 | 2 237.62 | 45.51% |
| 31.01.2020 | 6 899.04 | 6 876.89 | 22.15 | 0.32% | 4 803.54 | 2 095.50 | 43.62% |
| 31.12.2019 | 6 876.89 | 6 524.37 | 352.51 | 5.40% | 4 468.71 | 2 408.17 | 53.89% |
| 30.11.2019 | 6 524.37 | 6 474.00 | 50.37 | 0.78% | 4 279.55 | 2 244.82 | 52.45% |
| 31.10.2019 | 6 474.00 | 6 225.78 | 248.22 | 3.99% | 4 132.81 | 2 341.20 | 56.65% |
| 30.09.2019 | 6 225.78 | 6 096.94 | 128.84 | 2.11% | 4 480.47 | 1 745.31 | 38.95% |
| 31.08.2019 | 6 096.94 | 6 103.89 | -6.95 | -0.11% | 4 428.85 | 1 668.10 | 37.66% |
| 31.07.2019 | 6 103.89 | 5 992.17 | 111.72 | 1.86% | 4 298.57 | 1 805.32 | 42.00% |
| 30.06.2019 | 5 992.17 | 5 331.14 | 661.04 | 12.40% | 4 322.09 | 1 670.08 | 38.64% |
| 31.05.2019 | 5 331.14 | 5 453.91 | - 122.77 | -2.25% | 4 226.62 | 1 104.52 | 26.13% |
| 30.04.2019 | 5 453.91 | 5 223.82 | 230.10 | 4.40% | 3 958.08 | 1 495.83 | 37.79% |
| 31.03.2019 | 5 223.82 | 4 916.51 | 307.31 | 6.25% | 4 017.43 | 1 206.38 | 30.03% |
| 28.02.2019 | 4 916.51 | 4 803.54 | 112.97 | 2.35% | 3 945.17 | 971.34 | 24.62% |
| 31.01.2019 | 4 803.54 | 4 468.71 | 334.82 | 7.49% | 3 786.16 | 1 017.38 | 26.87% |
| 31.12.2018 | 4 468.71 | 4 279.55 | 189.16 | 4.42% | 3 549.03 | 919.68 | 25.91% |
| 30.11.2018 | 4 279.55 | 4 132.81 | 146.75 | 3.55% | 4 525.85 | - 246.29 | -5.44% |
| 31.10.2018 | 4 132.81 | 4 480.47 | - 347.67 | -7.76% | 4 543.79 | - 410.99 | -9.04% |
| 30.09.2018 | 4 480.47 | 4 428.85 | 51.62 | 1.17% | 4 436.88 | 43.59 | 0.98% |
| 31.08.2018 | 4 428.85 | 4 298.57 | 130.27 | 3.03% | 4 236.26 | 192.59 | 4.55% |
| 31.07.2018 | 4 298.57 | 4 322.09 | -23.52 | -0.54% | 4 125.51 | 173.07 | 4.20% |
| 30.06.2018 | 4 322.09 | 4 226.62 | 95.47 | 2.26% | 3 675.84 | 646.26 | 17.58% |
| 31.05.2018 | 4 226.62 | 3 958.08 | 268.54 | 6.78% | 3 672.16 | 554.46 | 15.10% |
| 30.04.2018 | 3 958.08 | 4 017.43 | -59.35 | -1.48% | 3 623.96 | 334.12 | 9.22% |
| 31.03.2018 | 4 017.43 | 3 945.17 | 72.26 | 1.83% | 3 632.74 | 384.69 | 10.59% |
| 28.02.2018 | 3 945.17 | 3 786.16 | 159.01 | 4.20% | 3 663.37 | 281.80 | 7.69% |
| 31.01.2018 | 3 786.16 | 3 549.03 | 237.13 | 6.68% | 3 505.69 | 280.47 | 8.00% |
| 31.12.2017 | 3 549.03 | 4 525.85 | - 976.82 | -21.58% | 3 478.38 | 70.66 | 2.03% |
| 30.11.2017 | 4 525.85 | 4 543.79 | -17.94 | -0.39% | 2 821.86 | 1 703.99 | 60.39% |
| 31.10.2017 | 4 543.79 | 4 436.88 | 106.91 | 2.41% | 2 778.63 | 1 765.16 | 63.53% |
| 30.09.2017 | 4 436.88 | 4 236.26 | 200.62 | 4.74% | 2 733.36 | 1 703.51 | 62.32% |
| 31.08.2017 | 4 236.26 | 4 125.51 | 110.75 | 2.68% | 2 512.96 | 1 723.30 | 68.58% |
| 31.07.2017 | 4 125.51 | 3 675.84 | 449.67 | 12.23% | 2 504.63 | 1 620.88 | 64.72% |
| 30.06.2017 | 3 675.84 | 3 672.16 | 3.67 | 0.10% | 2 331.88 | 1 343.95 | 57.63% |
| 31.05.2017 | 3 672.16 | 3 623.96 | 48.20 | 1.33% | 2 142.38 | 1 529.79 | 71.41% |
| 30.04.2017 | 3 623.96 | 3 632.74 | -8.78 | -0.24% | 2 010.58 | 1 613.38 | 80.24% |
| 31.03.2017 | 3 632.74 | 3 663.37 | -30.63 | -0.84% | 769.29 | 2 863.45 | 372.22% |
| 28.02.2017 | 3 663.37 | 3 505.69 | 157.68 | 4.50% | 767.76 | 2 895.61 | 377.15% |
| 31.01.2017 | 3 505.69 | 3 478.38 | 27.31 | 0.79% | 668.72 | 2 836.97 | 424.24% |
| 31.12.2016 | 3 478.38 | 2 821.86 | 656.52 | 23.27% | 719.88 | 2 758.49 | 383.19% |
| 30.11.2016 | 2 821.86 | 2 778.63 | 43.23 | 1.56% | 308.62 | 2 513.24 | 814.35% |
| 31.10.2016 | 2 778.63 | 2 733.36 | 45.26 | 1.66% | 266.34 | 2 512.29 | 943.28% |
| 30.09.2016 | 2 733.36 | 2 512.96 | 220.41 | 8.77% | 256.93 | 2 476.44 | 963.87% |
| 31.08.2016 | 2 512.96 | 2 504.63 | 8.33 | 0.33% | 257.85 | 2 255.11 | 874.58% |
| 31.07.2016 | 2 504.63 | 2 331.88 | 172.75 | 7.41% | 215.31 | 2 289.32 | 1 063.29% |
| 30.06.2016 | 2 331.88 | 2 142.38 | 189.50 | 8.85% | 208.00 | 2 123.88 | 1 021.11% |
| 31.05.2016 | 2 142.38 | 2 010.58 | 131.80 | 6.56% | 138.59 | 2 003.79 | 1 445.88% |
| 30.04.2016 | 2 010.58 | 769.29 | 1 241.29 | 161.36% | 137.97 | 1 872.61 | 1 357.25% |
| 31.03.2016 | 769.29 | 767.76 | 1.53 | 0.20% | 102.24 | 667.05 | 652.43% |
| 29.02.2016 | 767.76 | 668.72 | 99.04 | 14.81% | 101.33 | 666.43 | 657.71% |
| 31.01.2016 | 668.72 | 719.88 | -51.16 | -7.11% | 99.91 | 568.81 | 569.33% |
| 31.12.2015 | 719.88 | 308.62 | 411.26 | 133.26% | 108.11 | 611.77 | 565.86% |
| 30.11.2015 | 308.62 | 266.34 | 42.28 | 15.88% | 119.68 | 188.94 | 157.87% |
| 31.10.2015 | 266.34 | 256.93 | 9.41 | 3.66% | 120.57 | 145.77 | 120.90% |
| 30.09.2015 | 256.93 | 257.85 | -0.92 | -0.36% | 120.16 | 136.77 | 113.83% |
| 31.08.2015 | 257.85 | 215.31 | 42.54 | 19.76% | 120.65 | 137.20 | 113.72% |
| 31.07.2015 | 215.31 | 208.00 | 7.31 | 3.51% | 111.91 | 103.40 | 92.40% |
| 30.06.2015 | 208.00 | 138.59 | 69.41 | 50.09% | 109.84 | 98.16 | 89.36% |
| 31.05.2015 | 138.59 | 137.97 | 0.61 | 0.45% | 101.87 | 36.71 | 36.04% |
| 30.04.2015 | 137.97 | 102.24 | 35.73 | 34.95% | 101.23 | 36.74 | 36.30% |
| 31.03.2015 | 102.24 | 101.33 | 0.91 | 0.90% | 96.31 | 5.93 | 6.16% |
| 28.02.2015 | 101.33 | 99.91 | 1.42 | 1.42% | 95.44 | 5.89 | 6.17% |
| 31.01.2015 | 99.91 | 108.11 | -8.20 | -7.59% | 93.73 | 6.18 | 6.59% |
| 31.12.2014 | 108.11 | 119.68 | -11.57 | -9.66% | 93.73 | 14.39 | 15.35% |
| 30.11.2014 | 119.68 | 120.57 | -0.89 | -0.74% | 51.30 | 68.38 | 133.29% |
| 31.10.2014 | 120.57 | 120.16 | 0.41 | 0.34% | 50.53 | 70.03 | 138.60% |
| 30.09.2014 | 120.16 | 120.65 | -0.49 | -0.41% | 51.11 | 69.05 | 135.09% |
| 31.08.2014 | 120.65 | 111.91 | 8.74 | 7.81% | 53.39 | 67.26 | 125.97% |
| 31.07.2014 | 111.91 | 109.84 | 2.06 | 1.88% | 60.28 | 51.62 | 85.63% |
| 30.06.2014 | 109.84 | 101.87 | 7.97 | 7.82% | 60.48 | 49.36 | 81.62% |
| 31.05.2014 | 101.87 | 101.23 | 0.64 | 0.64% | 61.28 | 40.59 | 66.23% |
| 30.04.2014 | 101.23 | 96.31 | 4.92 | 5.11% | 64.55 | 36.68 | 56.82% |
| 31.03.2014 | 96.31 | 95.44 | 0.87 | 0.91% | 65.83 | 30.48 | 46.30% |
| 28.02.2014 | 95.44 | 93.73 | 1.71 | 1.82% | 64.99 | 30.45 | 46.85% |
| 31.01.2014 | 93.73 | 93.73 | 0.01 | 0.01% | 65.89 | 27.84 | 42.25% |
| 31.12.2013 | 93.73 | 51.30 | 42.43 | 82.70% | 65.84 | 27.89 | 42.36% |
| 30.11.2013 | 51.30 | 50.53 | 0.77 | 1.52% | 26.16 | 25.15 | 96.14% |
| 31.10.2013 | 50.53 | 51.11 | -0.58 | -1.13% | 26.16 | 24.38 | 93.20% |
| 30.09.2013 | 51.11 | 53.39 | -2.28 | -4.28% | 25.83 | 25.28 | 97.89% |
| 31.08.2013 | 53.39 | 60.28 | -6.89 | -11.43% | 25.83 | 27.57 | 106.73% |
| 31.07.2013 | 60.28 | 60.48 | -0.19 | -0.32% | 25.83 | 34.46 | 133.41% |
| 30.06.2013 | 60.48 | 61.28 | -0.81 | -1.32% | 4.75 | 55.72 | 1 172.13% |
| 31.05.2013 | 61.28 | 64.55 | -3.27 | -5.06% | 5.31 | 55.97 | 1 053.91% |
| 30.04.2013 | 64.55 | 65.83 | -1.27 | -1.93% | 5.31 | 59.24 | 1 115.44% |
| 31.03.2013 | 65.83 | 64.99 | 0.84 | 1.29% | 9.12 | 56.70 | 621.69% |
| 28.02.2013 | 64.99 | 65.89 | -0.91 | -1.37% | 9.12 | 55.87 | 612.51% |
| 31.01.2013 | 65.89 | 65.84 | 0.06 | 0.09% | 9.12 | 56.77 | 622.43% |
| 31.12.2012 | 65.84 | 26.16 | 39.68 | 151.71% | 24.77 | 41.07 | 165.84% |
| 30.11.2012 | 26.16 | 26.16 | 0.00 | 0.00 | 24.56 | 1.60 | 6.51% |
| 31.10.2012 | 26.16 | 25.83 | 0.33 | 1.27% | 25.01 | 1.15 | 4.59% |
| 30.09.2012 | 25.83 | 25.83 | 0.00 | 0.00 | 0.00 | 25.83 | - |
| 31.08.2012 | 25.83 | 25.83 | 0.00 | 0.00 | 0.00 | 25.83 | - |
| 31.07.2012 | 25.83 | 4.75 | 21.07 | 443.27% | 0.00 | 25.83 | - |
| 30.06.2012 | 4.75 | 5.31 | -0.56 | -10.49% | 0.00 | 4.75 | - |
| 31.05.2012 | 5.31 | 5.31 | 0.00 | 0.00 | 0.00 | 5.31 | - |
| 30.04.2012 | 5.31 | 9.12 | -3.81 | -41.77% | 0.00 | 5.31 | - |
| 31.03.2012 | 9.12 | 9.12 | 0.00 | 0.00 | 0.00 | 9.12 | - |
| 29.02.2012 | 9.12 | 9.12 | 0.00 | 0.00 | 0.00 | 9.12 | - |
| 31.01.2012 | 9.12 | 24.77 | -15.64 | -63.17% | 0.00 | 9.12 | - |
| 31.12.2011 | 24.77 | 24.56 | 0.21 | 0.85% | 0.00 | 24.77 | - |
| 30.11.2011 | 24.56 | 25.01 | -0.45 | -1.80% | 0.00 | 24.56 | - |
| 31.10.2011 | 25.01 | 0.00 | 25.01 | - | 0.00 | 25.01 | - |
| 30.09.2011 | 0.00 | 0.00 | 0.00 | - | 0.00 | 0.00 | - |
| 31.08.2011 | 0.00 | 0.00 | 0.00 | - | 0.00 | 0.00 | - |
| 31.07.2011 | 0.00 | 0.00 | 0.00 | - | 0.00 | 0.00 | - |
| 30.06.2011 | 0.00 | 0.00 | 0.00 | - | 0.00 | 0.00 | - |
| 31.05.2011 | 0.00 | 0.00 | 0.00 | - | 0.00 | 0.00 | - |
| 30.04.2011 | 0.00 | 0.00 | 0.00 | - | 0.00 | 0.00 | - |
| 31.03.2011 | 0.00 | 0.00 | 0.00 | - | 0.00 | 0.00 | - |
| 28.02.2011 | 0.00 | 0.00 | 0.00 | - | 0.00 | 0.00 | - |
| 31.01.2011 | 0.00 | 0.00 | 0.00 | - | 0.00 | 0.00 | - |
| 31.12.2010 | 0.00 | 0.00 | 0.00 | - | 0.00 | 0.00 | - |
| 30.11.2010 | 0.00 | 0.00 | 0.00 | - | 0.00 | 0.00 | - |
| 31.10.2010 | 0.00 | 0.00 | 0.00 | - | 0.00 | 0.00 | - |
| 30.09.2010 | 0.00 | 0.00 | 0.00 | - | 0.00 | 0.00 | - |
| 31.08.2010 | 0.00 | 0.00 | 0.00 | - | 0.00 | 0.00 | - |
| 31.07.2010 | 0.00 | 0.00 | 0.00 | - | 0.00 | 0.00 | - |
| 30.06.2010 | 0.00 | 0.00 | 0.00 | - | 0.00 | 0.00 | - |
| 31.05.2010 | 0.00 | 0.00 | 0.00 | - | 0.00 | 0.00 | - |
| 30.04.2010 | 0.00 | 0.00 | 0.00 | - | 0.00 | 0.00 | - |
| 31.03.2010 | 0.00 | 0.00 | 0.00 | - | - | - | - |
| 28.02.2010 | 0.00 | 0.00 | 0.00 | - | - | - | - |
| 31.01.2010 | 0.00 | 0.00 | 0.00 | - | - | - | - |
| 31.12.2009 | 0.00 | 0.00 | 0.00 | - | - | - | - |
| 30.11.2009 | 0.00 | 0.00 | 0.00 | - | - | - | - |
| 31.10.2009 | 0.00 | 0.00 | 0.00 | - | - | - | - |
| 30.09.2009 | 0.00 | 0.00 | 0.00 | - | - | - | - |
| 31.08.2009 | 0.00 | 0.00 | 0.00 | - | - | - | - |
| 31.07.2009 | 0.00 | 0.00 | 0.00 | - | - | - | - |
| 30.06.2009 | 0.00 | 0.00 | 0.00 | - | - | - | - |
| 31.05.2009 | 0.00 | 0.00 | 0.00 | - | - | - | - |
| 30.04.2009 | 0.00 | - | - | - | - | - | - |
Graf jako obrázek

Podobné sestavy
Aplikace Ekonomika ČNB ze sekce makroekonomika zobrazuje časové řady hlavních makroekonomických údajů z ekonomiky ČR. Najdete zde přes 10.000 grafů různých hodnot od úrokových sazeb, přes statistiky státního rozpočtu, statistiky ČNB a data zpracovávaná ČSÚ. Data jsou k dispozici obvykle za posledních více než 20 let, od prosince roku 1992. Zdroj dat: ČNB ARAD

