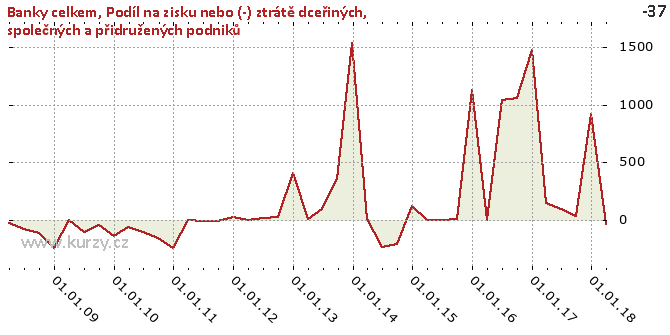
Share of the profit or (-) loss of investments in subsidaries, joint ventures and associates - ekonomika ČNB
Aktualizace dat
Share of the profit or (-) loss of investments in subsidaries, joint ventures and associates v této aplikaci skončila 30.6.2023. Aktualizovná data časových řad najdete na stránkách nové aplikace z dat
ARAD ČNB
Nové časové řady makroekonomiky a jejich data
| Data ke dni | Řada nebo sestava |
|---|
| 31.12.2023 |
Úvěry: Celkové náklady úvěrů domácnostem na bydlení v ČR vyjádřené ukazatelem cost of borrowing, Míra v %, Procenta, Měsíční |
| 30.11.2023 |
Úvěry: Celkove náklady úvěrů domácnostem na bydlení v EA vyjádřené ukazatelem cost of borrowing, Míra v %, Procenta, Měsíční |
| 31.12.2023 |
Úvěry: Celkové náklady úvěrů nefinančním podnikům v ČR vyjádřené ukazatelem cost of borrowing, Míra v %, Procenta, Měsíční |
| 30.11.2023 |
Úvěry: Celkové náklady úvěrů nefinančním podnikům v EA vyjádřené ukazatelem cost of borrowing, Míra v %, Procenta, Měsíční |
| - |
Podmíněný KD odliv(-)/příliv(+) deviz.aktiv (nominál.ocenění): Měsíční, Záznam o devizových opcích, které jsou in-the-money, USD |
| - |
Podmíněný KD odliv(-)/příliv(+) deviz.aktiv (nominál.ocenění): Měsíční, Záznam o devizových opcích, které jsou in-the-money, Do 1 měsíce, USD |
| - |
Podmíněný KD odliv(-)/příliv(+) deviz.aktiv (nominál.ocenění): Měsíční, Záznam o devizových opcích, které jsou in-the-money, Nad 1 měsíc do 3 měsíců, USD |
| - |
Podmíněný KD odliv(-)/příliv(+) deviz.aktiv (nominál.ocenění): Měsíční, Záznam o devizových opcích, které jsou in-the-money, Nad 3 měsíce do 1 roku, USD |
Graf hodnot, Banking sector, total
 Nahrávám interaktivní graf ...
Meziroční srovnání
Share of the profit or (-) loss of investments in subsidaries, joint ventures and associates - Nahrávám graf - roční srovnání ...
Minima a maxima
Historické hodnoty
| Období |
Hodnota |
Předchozí |
Rozdíl |
Změna |
Před rokem |
Rozdíl |
Změna |
| 31.03.2018 |
-37.00 |
917.00 |
- 954.00 |
- 104.03% |
145.00 |
- 182.00 |
- 125.52% |
| 31.12.2017 |
917.00 |
38.00 |
879.00 |
2 313.16% |
1 474.00 |
- 557.00 |
-37.79% |
| 30.09.2017 |
38.00 |
94.00 |
-56.00 |
-59.57% |
1 060.00 |
-1 022.00 |
-96.42% |
| 30.06.2017 |
94.00 |
145.00 |
-51.00 |
-35.17% |
1 046.00 |
- 952.00 |
-91.01% |
| 31.03.2017 |
145.00 |
1 474.00 |
-1 329.00 |
-90.16% |
0.00 |
145.00 |
- |
| 31.12.2016 |
1 474.00 |
1 060.00 |
414.00 |
39.06% |
1 130.00 |
344.00 |
30.44% |
| 30.09.2016 |
1 060.00 |
1 046.00 |
14.00 |
1.34% |
8.00 |
1 052.00 |
13 150.00% |
| 30.06.2016 |
1 046.00 |
0.00 |
1 046.00 |
- |
2.00 |
1 044.00 |
52 200.00% |
| 31.03.2016 |
0.00 |
1 130.00 |
-1 130.00 |
- |
-4.00 |
4.00 |
- |
| 31.12.2015 |
1 130.00 |
8.00 |
1 122.00 |
14 025.00% |
123.00 |
1 007.00 |
818.70% |
| 30.09.2015 |
8.00 |
2.00 |
6.00 |
300.00% |
- 206.00 |
214.00 |
- 103.88% |
| 30.06.2015 |
2.00 |
-4.00 |
6.00 |
- 150.00% |
- 239.00 |
241.00 |
- 100.84% |
| 31.03.2015 |
-4.00 |
123.00 |
- 127.00 |
- 103.25% |
8.00 |
-12.00 |
- 150.00% |
| 31.12.2014 |
123.00 |
- 206.00 |
329.00 |
- 159.71% |
1 541.00 |
-1 418.00 |
-92.02% |
| 30.09.2014 |
- 206.00 |
- 239.00 |
33.00 |
-13.81% |
355.00 |
- 561.00 |
- 158.03% |
| 30.06.2014 |
- 239.00 |
8.00 |
- 247.00 |
-3 087.50% |
97.00 |
- 336.00 |
- 346.39% |
| 31.03.2014 |
8.00 |
1 541.00 |
-1 533.00 |
-99.48% |
7.00 |
1.00 |
14.29% |
| 31.12.2013 |
1 541.00 |
355.00 |
1 186.00 |
334.08% |
407.00 |
1 134.00 |
278.62% |
| 30.09.2013 |
355.00 |
97.00 |
258.00 |
265.98% |
28.00 |
327.00 |
1 167.86% |
| 30.06.2013 |
97.00 |
7.00 |
90.00 |
1 285.71% |
16.00 |
81.00 |
506.25% |
| 31.03.2013 |
7.00 |
407.00 |
- 400.00 |
-98.28% |
-1.00 |
8.00 |
- 800.00% |
| 31.12.2012 |
407.00 |
28.00 |
379.00 |
1 353.57% |
29.00 |
378.00 |
1 303.45% |
| 30.09.2012 |
28.00 |
16.00 |
12.00 |
75.00% |
-13.00 |
41.00 |
- 315.38% |
| 30.06.2012 |
16.00 |
-1.00 |
17.00 |
-1 700.00% |
-9.00 |
25.00 |
- 277.78% |
| 31.03.2012 |
-1.00 |
29.00 |
-30.00 |
- 103.45% |
-5.00 |
4.00 |
-80.00% |
| 31.12.2011 |
29.00 |
-13.00 |
42.00 |
- 323.08% |
- 244.00 |
273.00 |
- 111.89% |
| 30.09.2011 |
-13.00 |
-9.00 |
-4.00 |
44.44% |
- 160.00 |
147.00 |
-91.88% |
| 30.06.2011 |
-9.00 |
-5.00 |
-4.00 |
80.00% |
- 103.00 |
94.00 |
-91.26% |
| 31.03.2011 |
-5.00 |
- 244.00 |
239.00 |
-97.95% |
-60.00 |
55.00 |
-91.67% |
| 31.12.2010 |
- 244.00 |
- 160.00 |
-84.00 |
52.50% |
- 138.00 |
- 106.00 |
76.81% |
| 30.09.2010 |
- 160.00 |
- 103.00 |
-57.00 |
55.34% |
-46.00 |
- 114.00 |
247.83% |
| 30.06.2010 |
- 103.00 |
-60.00 |
-43.00 |
71.67% |
- 103.00 |
0.00 |
0.00 |
| 31.03.2010 |
-60.00 |
- 138.00 |
78.00 |
-56.52% |
3.00 |
-63.00 |
-2 100.00% |
| 31.12.2009 |
- 138.00 |
-46.00 |
-92.00 |
200.00% |
- 248.00 |
110.00 |
-44.35% |
| 30.09.2009 |
-46.00 |
- 103.00 |
57.00 |
-55.34% |
- 116.00 |
70.00 |
-60.34% |
| 30.06.2009 |
- 103.00 |
3.00 |
- 106.00 |
-3 533.33% |
-78.00 |
-25.00 |
32.05% |
| 31.03.2009 |
3.00 |
- 248.00 |
251.00 |
- 101.21% |
-31.00 |
34.00 |
- 109.68% |
| 31.12.2008 |
- 248.00 |
- 116.00 |
- 132.00 |
113.79% |
- |
- |
- |
| 30.09.2008 |
- 116.00 |
-78.00 |
-38.00 |
48.72% |
- |
- |
- |
| 30.06.2008 |
-78.00 |
-31.00 |
-47.00 |
151.61% |
- |
- |
- |
| 31.03.2008 |
-31.00 |
- |
- |
- |
- |
- |
- |
Graf jako obrázek
Ekonomické ukazatele České národní banky
Podobné sestavy
| Vyberte název statistické sestavy dat, kterou chcete prohlédnout |
|---|
|
Share of the profit or (-) loss of investments in subsidaries, joint ventures and associates (Banking sector, total)
|
|
Share of the profit or (-) loss of investments in subsidaries, joint ventures and associates (Large banks)
|
|
Share of the profit or (-) loss of investments in subsidaries, joint ventures and associates (Medium-sized banks)
|
|
Share of the profit or (-) loss of investments in subsidaries, joint ventures and associates (Building societies)
|
|
Share of the profit or (-) loss of investments in subsidaries, joint ventures and associates (P&L statement (in CZK thousands))
|
|
Share of the profit or (-) loss of investments in subsidaries, joint ventures and associates (Small banks)
|
|
Share of the profit or (-) loss of investments in subsidaries, joint ventures and associates (Foreign bank branches)
|
|
Share of the profit or (-) loss of investments in subsidaries, joint ventures and associates (Investment firms total (in CZK thousands))
|
|
Share of the profit or (-) loss of investments in subsidaries, joint ventures and associates (Investment firms - non-banks (in CZK thousands))
|
|
Share of the profit or (-) loss of investments in subsidaries, joint ventures and associates (Foreign IFs branches (in CZK thousands))
|
|
Monetary and financial statistics (Statistical data)
|
|
Statistics of monetary developments in the CR (Monetary statistics)
|
|
Aggregated balance sheet of the Czech National Bank - assets (Balance sheet of the Czech National Bank)
|
|
Holdings of securities other than shares issued by residents - total (Aggregated balance sheet of the Czech National Bank - assets)
|
|
Holdings of securities other than shares issued by residents - MFIs (Aggregated balance sheet of the Czech National Bank - assets)
|
|
Holdings of securities other than shares issued by residents - General government (Aggregated balance sheet of the Czech National Bank - assets)
|
|
Holdings of securities other than shares issued by residents - Other residents (Aggregated balance sheet of the Czech National Bank - assets)
|
|
Holdings of shares/ other equity issued by residents - total (Aggregated balance sheet of the Czech National Bank - assets)
|
|
Holdings of shares/ other equity issued by residents - MFIs (Aggregated balance sheet of the Czech National Bank - assets)
|
|
Holdings of shares/ other equity issued by residents - Other residents (Aggregated balance sheet of the Czech National Bank - assets)
|
Aplikace Ekonomika ČNB ze sekce makroekonomika
zobrazuje časové řady hlavních makroekonomických údajů z ekonomiky ČR.
Najdete zde přes 10.000 grafů různých hodnot od úrokových sazeb, přes statistiky státního rozpočtu, statistiky ČNB a data zpracovávaná ČSÚ.
Data jsou k dispozici obvykle za posledních více než 20 let, od prosince roku 1992.
Zdroj dat: ČNB ARAD
Zobrazit sloupec


