Insurance corporations and pension funds - total, Kvartální součty - ekonomika ČNB
Aktualizace dat Insurance corporations and pension funds - total v této aplikaci skončila 30.6.2023. Aktualizovná data časových řad najdete na stránkách nové aplikace z dat ARAD ČNB
Nové časové řady makroekonomiky a jejich data
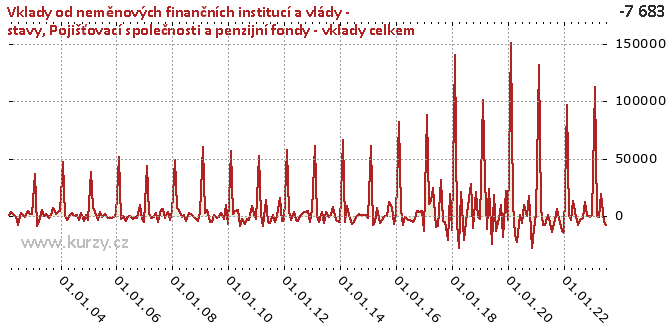
Graf hodnot, Deposits by non-monetary financial corporations and by government - stocks
Kvartální součty
Zpět na základní časovou řadu Insurance corporations and pension funds - total| Období | Hodnota | Předchozí | Rozdíl | Změna | Před rokem | Rozdíl | Změna |
|---|---|---|---|---|---|---|---|
| 01.07.2020 | 126 394.80 | 362 477.40 | - 236 082.60 | -65.13% | 380 873.10 | - 254 478.30 | -66.81% |
| 01.04.2020 | 362 477.40 | 456 978.30 | -94 500.90 | -20.68% | 402 487.60 | -40 010.20 | -9.94% |
| 01.01.2020 | 456 978.30 | 381 813.80 | 75 164.50 | 19.69% | 353 559.20 | 103 419.10 | 29.25% |
| 01.10.2019 | 381 813.80 | 380 873.10 | 940.70 | 0.25% | 439 032.50 | -57 218.70 | -13.03% |
| 01.07.2019 | 380 873.10 | 402 487.60 | -21 614.50 | -5.37% | 371 552.30 | 9 320.80 | 2.51% |
| 01.04.2019 | 402 487.60 | 353 559.20 | 48 928.40 | 13.84% | 331 661.50 | 70 826.10 | 21.35% |
| 01.01.2019 | 353 559.20 | 439 032.50 | -85 473.30 | -19.47% | 378 018.20 | -24 459.00 | -6.47% |
| 01.10.2018 | 439 032.50 | 371 552.30 | 67 480.20 | 18.16% | 379 900.30 | 59 132.20 | 15.57% |
| 01.07.2018 | 371 552.30 | 331 661.50 | 39 890.80 | 12.03% | 431 707.80 | -60 155.50 | -13.93% |
| 01.04.2018 | 331 661.50 | 378 018.20 | -46 356.70 | -12.26% | 379 413.70 | -47 752.20 | -12.59% |
| 01.01.2018 | 378 018.20 | 379 900.30 | -1 882.10 | -0.50% | 297 220.50 | 80 797.70 | 27.18% |
| 01.10.2017 | 379 900.30 | 431 707.80 | -51 807.50 | -12.00% | 211 882.20 | 168 018.10 | 79.30% |
| 01.07.2017 | 431 707.80 | 379 413.70 | 52 294.10 | 13.78% | 199 413.70 | 232 294.10 | 116.49% |
| 01.04.2017 | 379 413.70 | 297 220.50 | 82 193.20 | 27.65% | 226 169.20 | 153 244.50 | 67.76% |
| 01.01.2017 | 297 220.50 | 211 882.20 | 85 338.30 | 40.28% | 248 809.80 | 48 410.70 | 19.46% |
| 01.10.2016 | 211 882.20 | 199 413.70 | 12 468.50 | 6.25% | 188 421.90 | 23 460.30 | 12.45% |
| 01.07.2016 | 199 413.70 | 226 169.20 | -26 755.50 | -11.83% | 150 903.70 | 48 510.00 | 32.15% |
| 01.04.2016 | 226 169.20 | 248 809.80 | -22 640.60 | -9.10% | 150 643.40 | 75 525.80 | 50.14% |
| 01.01.2016 | 248 809.80 | 188 421.90 | 60 387.90 | 32.05% | 163 322.50 | 85 487.30 | 52.34% |
| 01.10.2015 | 188 421.90 | 150 903.70 | 37 518.20 | 24.86% | 185 638.40 | 2 783.50 | 1.50% |
| 01.07.2015 | 150 903.70 | 150 643.40 | 260.30 | 0.17% | 179 454.50 | -28 550.80 | -15.91% |
| 01.04.2015 | 150 643.40 | 163 322.50 | -12 679.10 | -7.76% | 192 436.50 | -41 793.10 | -21.72% |
| 01.01.2015 | 163 322.50 | 185 638.40 | -22 315.90 | -12.02% | 197 095.30 | -33 772.80 | -17.14% |
| 01.10.2014 | 185 638.40 | 179 454.50 | 6 183.90 | 3.45% | 167 574.70 | 18 063.70 | 10.78% |
| 01.07.2014 | 179 454.50 | 192 436.50 | -12 982.00 | -6.75% | 175 890.20 | 3 564.30 | 2.03% |
| 01.04.2014 | 192 436.50 | 197 095.30 | -4 658.80 | -2.36% | 167 945.20 | 24 491.30 | 14.58% |
| 01.01.2014 | 197 095.30 | 167 574.70 | 29 520.60 | 17.62% | 177 402.50 | 19 692.80 | 11.10% |
| 01.10.2013 | 167 574.70 | 175 890.20 | -8 315.50 | -4.73% | 186 327.30 | -18 752.60 | -10.06% |
| 01.07.2013 | 175 890.20 | 167 945.20 | 7 945.00 | 4.73% | 167 886.60 | 8 003.60 | 4.77% |
| 01.04.2013 | 167 945.20 | 177 402.50 | -9 457.30 | -5.33% | 170 082.50 | -2 137.30 | -1.26% |
| 01.01.2013 | 177 402.50 | 186 327.30 | -8 924.80 | -4.79% | 174 481.10 | 2 921.40 | 1.67% |
| 01.10.2012 | 186 327.30 | 167 886.60 | 18 440.70 | 10.98% | 164 133.50 | 22 193.80 | 13.52% |
| 01.07.2012 | 167 886.60 | 170 082.50 | -2 195.90 | -1.29% | 136 303.80 | 31 582.80 | 23.17% |
| 01.04.2012 | 170 082.50 | 174 481.10 | -4 398.60 | -2.52% | 160 238.90 | 9 843.60 | 6.14% |
| 01.01.2012 | 174 481.10 | 164 133.50 | 10 347.60 | 6.30% | 149 227.60 | 25 253.50 | 16.92% |
| 01.10.2011 | 164 133.50 | 136 303.80 | 27 829.70 | 20.42% | 156 822.60 | 7 310.90 | 4.66% |
| 01.07.2011 | 136 303.80 | 160 238.90 | -23 935.10 | -14.94% | 138 752.60 | -2 448.80 | -1.76% |
| 01.04.2011 | 160 238.90 | 149 227.60 | 11 011.30 | 7.38% | 181 280.90 | -21 042.00 | -11.61% |
| 01.01.2011 | 149 227.60 | 156 822.60 | -7 595.00 | -4.84% | 175 988.30 | -26 760.70 | -15.21% |
| 01.10.2010 | 156 822.60 | 138 752.60 | 18 070.00 | 13.02% | 179 228.90 | -22 406.30 | -12.50% |
| 01.07.2010 | 138 752.60 | 181 280.90 | -42 528.30 | -23.46% | 171 664.80 | -32 912.20 | -19.17% |
| 01.04.2010 | 181 280.90 | 175 988.30 | 5 292.60 | 3.01% | 178 707.10 | 2 573.80 | 1.44% |
| 01.01.2010 | 175 988.30 | 179 228.90 | -3 240.60 | -1.81% | 190 018.50 | -14 030.20 | -7.38% |
| 01.10.2009 | 179 228.90 | 171 664.80 | 7 564.10 | 4.41% | 165 232.60 | 13 996.30 | 8.47% |
| 01.07.2009 | 171 664.80 | 178 707.10 | -7 042.30 | -3.94% | 177 663.40 | -5 998.60 | -3.38% |
| 01.04.2009 | 178 707.10 | 190 018.50 | -11 311.40 | -5.95% | 174 354.20 | 4 352.90 | 2.50% |
| 01.01.2009 | 190 018.50 | 165 232.60 | 24 785.90 | 15.00% | 164 432.50 | 25 586.00 | 15.56% |
| 01.10.2008 | 165 232.60 | 177 663.40 | -12 430.80 | -7.00% | 157 119.20 | 8 113.40 | 5.16% |
| 01.07.2008 | 177 663.40 | 174 354.20 | 3 309.20 | 1.90% | 146 011.20 | 31 652.20 | 21.68% |
| 01.04.2008 | 174 354.20 | 164 432.50 | 9 921.70 | 6.03% | 128 754.00 | 45 600.20 | 35.42% |
| 01.01.2008 | 164 432.50 | 157 119.20 | 7 313.30 | 4.65% | 130 825.70 | 33 606.80 | 25.69% |
| 01.10.2007 | 157 119.20 | 146 011.20 | 11 108.00 | 7.61% | 136 801.10 | 20 318.10 | 14.85% |
| 01.07.2007 | 146 011.20 | 128 754.00 | 17 257.20 | 13.40% | 121 175.20 | 24 836.00 | 20.50% |
| 01.04.2007 | 128 754.00 | 130 825.70 | -2 071.70 | -1.58% | 132 962.70 | -4 208.70 | -3.17% |
| 01.01.2007 | 130 825.70 | 136 801.10 | -5 975.40 | -4.37% | 150 710.60 | -19 884.90 | -13.19% |
| 01.10.2006 | 136 801.10 | 121 175.20 | 15 625.90 | 12.90% | 138 273.40 | -1 472.30 | -1.06% |
| 01.07.2006 | 121 175.20 | 132 962.70 | -11 787.50 | -8.87% | 147 568.70 | -26 393.50 | -17.89% |
| 01.04.2006 | 132 962.70 | 150 710.60 | -17 747.90 | -11.78% | 141 626.90 | -8 664.20 | -6.12% |
| 01.01.2006 | 150 710.60 | 138 273.40 | 12 437.20 | 8.99% | 131 880.30 | 18 830.30 | 14.28% |
| 01.10.2005 | 138 273.40 | 147 568.70 | -9 295.30 | -6.30% | 127 039.20 | 11 234.20 | 8.84% |
| 01.07.2005 | 147 568.70 | 141 626.90 | 5 941.80 | 4.20% | 139 338.40 | 8 230.30 | 5.91% |
| 01.04.2005 | 141 626.90 | 131 880.30 | 9 746.60 | 7.39% | 137 395.60 | 4 231.30 | 3.08% |
| 01.01.2005 | 131 880.30 | 127 039.20 | 4 841.10 | 3.81% | 136 463.80 | -4 583.50 | -3.36% |
| 01.10.2004 | 127 039.20 | 139 338.40 | -12 299.20 | -8.83% | 124 312.50 | 2 726.70 | 2.19% |
| 01.07.2004 | 139 338.40 | 137 395.60 | 1 942.80 | 1.41% | 94 005.40 | 45 333.00 | 48.22% |
| 01.04.2004 | 137 395.60 | 136 463.80 | 931.80 | 0.68% | 89 257.10 | 48 138.50 | 53.93% |
| 01.01.2004 | 136 463.80 | 124 312.50 | 12 151.30 | 9.77% | 88 749.00 | 47 714.80 | 53.76% |
| 01.10.2003 | 124 312.50 | 94 005.40 | 30 307.10 | 32.24% | 113 489.10 | 10 823.40 | 9.54% |
| 01.07.2003 | 94 005.40 | 89 257.10 | 4 748.30 | 5.32% | 96 807.60 | -2 802.20 | -2.89% |
| 01.04.2003 | 89 257.10 | 88 749.00 | 508.10 | 0.57% | 104 174.50 | -14 917.40 | -14.32% |
| 01.01.2003 | 88 749.00 | 113 489.10 | -24 740.10 | -21.80% | 104 090.70 | -15 341.70 | -14.74% |
| 01.10.2002 | 113 489.10 | 96 807.60 | 16 681.50 | 17.23% | - | - | - |
| 01.07.2002 | 96 807.60 | 104 174.50 | -7 366.90 | -7.07% | - | - | - |
| 01.04.2002 | 104 174.50 | 104 090.70 | 83.80 | 0.08% | - | - | - |
| 01.01.2002 | 104 090.70 | - | - | - | - | - | - |
Podobné sestavy
Aplikace Ekonomika ČNB ze sekce makroekonomika zobrazuje časové řady hlavních makroekonomických údajů z ekonomiky ČR. Najdete zde přes 10.000 grafů různých hodnot od úrokových sazeb, přes statistiky státního rozpočtu, statistiky ČNB a data zpracovávaná ČSÚ. Data jsou k dispozici obvykle za posledních více než 20 let, od prosince roku 1992. Zdroj dat: ČNB ARAD

