Overnight deposits - Outstanding amounts, Kvartální součty - ekonomika ČNB
Aktualizace dat Overnight deposits - Outstanding amounts v této aplikaci skončila 30.6.2023. Aktualizovná data časových řad najdete na stránkách nové aplikace z dat ARAD ČNB
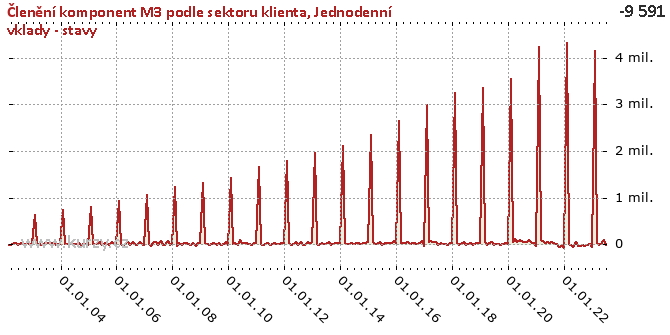
Graf hodnot, Sector breakdown of components of M3
Kvartální součty
Zpět na základní časovou řadu Overnight deposits - Outstanding amounts| Období | Hodnota | Předchozí | Rozdíl | Změna | Před rokem | Rozdíl | Změna |
|---|---|---|---|---|---|---|---|
| 01.07.2020 | 3 978 142.50 | 11 550 070.53 | -7 571 928.03 | -65.56% | 10 425 708.80 | -6 447 566.30 | -61.84% |
| 01.04.2020 | 11 550 070.53 | 10 867 074.61 | 682 995.92 | 6.29% | 10 358 935.11 | 1 191 135.41 | 11.50% |
| 01.01.2020 | 10 867 074.61 | 10 536 184.34 | 330 890.26 | 3.14% | 10 161 395.91 | 705 678.70 | 6.94% |
| 01.10.2019 | 10 536 184.34 | 10 425 708.80 | 110 475.55 | 1.06% | 10 098 542.77 | 437 641.58 | 4.33% |
| 01.07.2019 | 10 425 708.80 | 10 358 935.11 | 66 773.68 | 0.64% | 9 994 434.44 | 431 274.36 | 4.32% |
| 01.04.2019 | 10 358 935.11 | 10 161 395.91 | 197 539.20 | 1.94% | 9 900 963.66 | 457 971.45 | 4.63% |
| 01.01.2019 | 10 161 395.91 | 10 098 542.77 | 62 853.14 | 0.62% | 9 748 117.51 | 413 278.40 | 4.24% |
| 01.10.2018 | 10 098 542.77 | 9 994 434.44 | 104 108.33 | 1.04% | 9 609 614.36 | 488 928.41 | 5.09% |
| 01.07.2018 | 9 994 434.44 | 9 900 963.66 | 93 470.78 | 0.94% | 9 564 719.52 | 429 714.92 | 4.49% |
| 01.04.2018 | 9 900 963.66 | 9 748 117.51 | 152 846.16 | 1.57% | 9 462 408.70 | 438 554.97 | 4.63% |
| 01.01.2018 | 9 748 117.51 | 9 609 614.36 | 138 503.15 | 1.44% | 9 115 322.80 | 632 794.71 | 6.94% |
| 01.10.2017 | 9 609 614.36 | 9 564 719.52 | 44 894.84 | 0.47% | 8 730 051.50 | 879 562.85 | 10.08% |
| 01.07.2017 | 9 564 719.52 | 9 462 408.70 | 102 310.82 | 1.08% | 8 498 258.70 | 1 066 460.82 | 12.55% |
| 01.04.2017 | 9 462 408.70 | 9 115 322.80 | 347 085.90 | 3.81% | 8 286 223.99 | 1 176 184.71 | 14.19% |
| 01.01.2017 | 9 115 322.80 | 8 730 051.50 | 385 271.30 | 4.41% | 8 012 962.63 | 1 102 360.17 | 13.76% |
| 01.10.2016 | 8 730 051.50 | 8 498 258.70 | 231 792.81 | 2.73% | 7 805 576.20 | 924 475.30 | 11.84% |
| 01.07.2016 | 8 498 258.70 | 8 286 223.99 | 212 034.70 | 2.56% | 7 507 706.12 | 990 552.58 | 13.19% |
| 01.04.2016 | 8 286 223.99 | 8 012 962.63 | 273 261.36 | 3.41% | 7 300 031.46 | 986 192.53 | 13.51% |
| 01.01.2016 | 8 012 962.63 | 7 805 576.20 | 207 386.43 | 2.66% | 7 111 667.55 | 901 295.08 | 12.67% |
| 01.10.2015 | 7 805 576.20 | 7 507 706.12 | 297 870.09 | 3.97% | 6 969 795.88 | 835 780.32 | 11.99% |
| 01.07.2015 | 7 507 706.12 | 7 300 031.46 | 207 674.65 | 2.84% | 6 699 081.37 | 808 624.74 | 12.07% |
| 01.04.2015 | 7 300 031.46 | 7 111 667.55 | 188 363.92 | 2.65% | 6 524 907.99 | 775 123.47 | 11.88% |
| 01.01.2015 | 7 111 667.55 | 6 969 795.88 | 141 871.67 | 2.04% | 6 380 397.45 | 731 270.10 | 11.46% |
| 01.10.2014 | 6 969 795.88 | 6 699 081.37 | 270 714.51 | 4.04% | 6 244 504.03 | 725 291.85 | 11.61% |
| 01.07.2014 | 6 699 081.37 | 6 524 907.99 | 174 173.38 | 2.67% | 6 092 451.54 | 606 629.83 | 9.96% |
| 01.04.2014 | 6 524 907.99 | 6 380 397.45 | 144 510.54 | 2.26% | 5 982 450.07 | 542 457.92 | 9.07% |
| 01.01.2014 | 6 380 397.45 | 6 244 504.03 | 135 893.43 | 2.18% | 5 891 551.09 | 488 846.36 | 8.30% |
| 01.10.2013 | 6 244 504.03 | 6 092 451.54 | 152 052.49 | 2.50% | 5 757 519.50 | 486 984.52 | 8.46% |
| 01.07.2013 | 6 092 451.54 | 5 982 450.07 | 110 001.46 | 1.84% | 5 586 616.06 | 505 835.48 | 9.05% |
| 01.04.2013 | 5 982 450.07 | 5 891 551.09 | 90 898.99 | 1.54% | 5 468 239.91 | 514 210.16 | 9.40% |
| 01.01.2013 | 5 891 551.09 | 5 757 519.50 | 134 031.59 | 2.33% | 5 370 981.34 | 520 569.75 | 9.69% |
| 01.10.2012 | 5 757 519.50 | 5 586 616.06 | 170 903.44 | 3.06% | 5 239 212.62 | 518 306.88 | 9.89% |
| 01.07.2012 | 5 586 616.06 | 5 468 239.91 | 118 376.15 | 2.16% | 5 123 305.33 | 463 310.73 | 9.04% |
| 01.04.2012 | 5 468 239.91 | 5 370 981.34 | 97 258.57 | 1.81% | 5 067 529.51 | 400 710.40 | 7.91% |
| 01.01.2012 | 5 370 981.34 | 5 239 212.62 | 131 768.72 | 2.52% | 5 012 448.92 | 358 532.42 | 7.15% |
| 01.10.2011 | 5 239 212.62 | 5 123 305.33 | 115 907.29 | 2.26% | 4 932 224.48 | 306 988.14 | 6.22% |
| 01.07.2011 | 5 123 305.33 | 5 067 529.51 | 55 775.82 | 1.10% | 4 826 721.04 | 296 584.28 | 6.14% |
| 01.04.2011 | 5 067 529.51 | 5 012 448.92 | 55 080.59 | 1.10% | 4 538 905.70 | 528 623.81 | 11.65% |
| 01.01.2011 | 5 012 448.92 | 4 932 224.48 | 80 224.44 | 1.63% | 4 285 059.02 | 727 389.90 | 16.98% |
| 01.10.2010 | 4 932 224.48 | 4 826 721.04 | 105 503.44 | 2.19% | 4 225 221.71 | 707 002.77 | 16.73% |
| 01.07.2010 | 4 826 721.04 | 4 538 905.70 | 287 815.34 | 6.34% | 4 105 408.23 | 721 312.82 | 17.57% |
| 01.04.2010 | 4 538 905.70 | 4 285 059.02 | 253 846.68 | 5.92% | 4 027 969.87 | 510 935.83 | 12.68% |
| 01.01.2010 | 4 285 059.02 | 4 225 221.71 | 59 837.31 | 1.42% | 3 959 163.65 | 325 895.37 | 8.23% |
| 01.10.2009 | 4 225 221.71 | 4 105 408.23 | 119 813.49 | 2.92% | 3 857 342.97 | 367 878.74 | 9.54% |
| 01.07.2009 | 4 105 408.23 | 4 027 969.87 | 77 438.36 | 1.92% | 3 848 115.18 | 257 293.05 | 6.69% |
| 01.04.2009 | 4 027 969.87 | 3 959 163.65 | 68 806.22 | 1.74% | 3 720 352.67 | 307 617.20 | 8.27% |
| 01.01.2009 | 3 959 163.65 | 3 857 342.97 | 101 820.67 | 2.64% | 3 675 994.35 | 283 169.30 | 7.70% |
| 01.10.2008 | 3 857 342.97 | 3 848 115.18 | 9 227.80 | 0.24% | 3 589 651.78 | 267 691.19 | 7.46% |
| 01.07.2008 | 3 848 115.18 | 3 720 352.67 | 127 762.51 | 3.43% | 3 467 406.26 | 380 708.92 | 10.98% |
| 01.04.2008 | 3 720 352.67 | 3 675 994.35 | 44 358.32 | 1.21% | 3 325 071.17 | 395 281.50 | 11.89% |
| 01.01.2008 | 3 675 994.35 | 3 589 651.78 | 86 342.57 | 2.41% | 3 173 519.00 | 502 475.35 | 15.83% |
| 01.10.2007 | 3 589 651.78 | 3 467 406.26 | 122 245.53 | 3.53% | 3 107 262.63 | 482 389.16 | 15.52% |
| 01.07.2007 | 3 467 406.26 | 3 325 071.17 | 142 335.08 | 4.28% | 2 998 722.73 | 468 683.52 | 15.63% |
| 01.04.2007 | 3 325 071.17 | 3 173 519.00 | 151 552.18 | 4.78% | 2 871 035.72 | 454 035.45 | 15.81% |
| 01.01.2007 | 3 173 519.00 | 3 107 262.63 | 66 256.37 | 2.13% | 2 756 597.08 | 416 921.92 | 15.12% |
| 01.10.2006 | 3 107 262.63 | 2 998 722.73 | 108 539.89 | 3.62% | 2 678 146.72 | 429 115.91 | 16.02% |
| 01.07.2006 | 2 998 722.73 | 2 871 035.72 | 127 687.01 | 4.45% | 2 541 166.57 | 457 556.16 | 18.01% |
| 01.04.2006 | 2 871 035.72 | 2 756 597.08 | 114 438.64 | 4.15% | 2 452 102.71 | 418 933.01 | 17.08% |
| 01.01.2006 | 2 756 597.08 | 2 678 146.72 | 78 450.35 | 2.93% | 2 380 975.01 | 375 622.07 | 15.78% |
| 01.10.2005 | 2 678 146.72 | 2 541 166.57 | 136 980.15 | 5.39% | 2 393 926.76 | 284 219.96 | 11.87% |
| 01.07.2005 | 2 541 166.57 | 2 452 102.71 | 89 063.86 | 3.63% | 2 378 178.11 | 162 988.46 | 6.85% |
| 01.04.2005 | 2 452 102.71 | 2 380 975.01 | 71 127.70 | 2.99% | 2 306 506.56 | 145 596.15 | 6.31% |
| 01.01.2005 | 2 380 975.01 | 2 393 926.76 | -12 951.75 | -0.54% | 2 197 702.32 | 183 272.69 | 8.34% |
| 01.10.2004 | 2 393 926.76 | 2 378 178.11 | 15 748.65 | 0.66% | 2 196 068.51 | 197 858.25 | 9.01% |
| 01.07.2004 | 2 378 178.11 | 2 306 506.56 | 71 671.55 | 3.11% | 2 114 134.53 | 264 043.58 | 12.49% |
| 01.04.2004 | 2 306 506.56 | 2 197 702.32 | 108 804.24 | 4.95% | 1 973 127.80 | 333 378.76 | 16.90% |
| 01.01.2004 | 2 197 702.32 | 2 196 068.51 | 1 633.80 | 0.07% | 1 914 769.63 | 282 932.68 | 14.78% |
| 01.10.2003 | 2 196 068.51 | 2 114 134.53 | 81 933.98 | 3.88% | 1 895 478.39 | 300 590.12 | 15.86% |
| 01.07.2003 | 2 114 134.53 | 1 973 127.80 | 141 006.73 | 7.15% | 1 796 288.01 | 317 846.53 | 17.69% |
| 01.04.2003 | 1 973 127.80 | 1 914 769.63 | 58 358.17 | 3.05% | 1 661 428.06 | 311 699.74 | 18.76% |
| 01.01.2003 | 1 914 769.63 | 1 895 478.39 | 19 291.24 | 1.02% | 1 597 396.80 | 317 372.83 | 19.87% |
| 01.10.2002 | 1 895 478.39 | 1 796 288.01 | 99 190.38 | 5.52% | - | - | - |
| 01.07.2002 | 1 796 288.01 | 1 661 428.06 | 134 859.95 | 8.12% | - | - | - |
| 01.04.2002 | 1 661 428.06 | 1 597 396.80 | 64 031.26 | 4.01% | - | - | - |
| 01.01.2002 | 1 597 396.80 | - | - | - | - | - | - |
Podobné sestavy
Aplikace Ekonomika ČNB ze sekce makroekonomika zobrazuje časové řady hlavních makroekonomických údajů z ekonomiky ČR. Najdete zde přes 10.000 grafů různých hodnot od úrokových sazeb, přes statistiky státního rozpočtu, statistiky ČNB a data zpracovávaná ČSÚ. Data jsou k dispozici obvykle za posledních více než 20 let, od prosince roku 1992. Zdroj dat: ČNB ARAD

