Other debt securities - general government (residents), Kvartální součty - ekonomika ČNB
Aktualizace dat Other debt securities - general government (residents) v této aplikaci skončila 30.6.2023. Aktualizovná data časových řad najdete na stránkách nové aplikace z dat ARAD ČNB
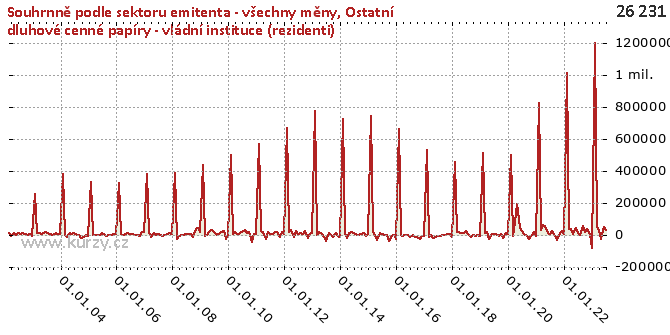
Graf hodnot, Total in sectoral breakdown of issuers - all currencies
Kvartální součty
Zpět na základní časovou řadu Other debt securities - general government (residents)| Období | Hodnota | Předchozí | Rozdíl | Změna | Před rokem | Rozdíl | Změna |
|---|---|---|---|---|---|---|---|
| 01.07.2020 | 819 377.60 | 2 373 826.40 | -1 554 448.80 | -65.48% | 1 556 168.70 | - 736 791.10 | -47.35% |
| 01.04.2020 | 2 373 826.40 | 1 557 815.80 | 816 010.60 | 52.38% | 1 544 219.60 | 829 606.80 | 53.72% |
| 01.01.2020 | 1 557 815.80 | 1 499 214.60 | 58 601.20 | 3.91% | 1 573 709.10 | -15 893.30 | -1.01% |
| 01.10.2019 | 1 499 214.60 | 1 556 168.70 | -56 954.10 | -3.66% | 1 522 907.40 | -23 692.80 | -1.56% |
| 01.07.2019 | 1 556 168.70 | 1 544 219.60 | 11 949.10 | 0.77% | 1 581 530.40 | -25 361.70 | -1.60% |
| 01.04.2019 | 1 544 219.60 | 1 573 709.10 | -29 489.50 | -1.87% | 1 545 217.10 | - 997.50 | -0.06% |
| 01.01.2019 | 1 573 709.10 | 1 522 907.40 | 50 801.70 | 3.34% | 1 420 654.10 | 153 055.00 | 10.77% |
| 01.10.2018 | 1 522 907.40 | 1 581 530.40 | -58 623.00 | -3.71% | 1 380 512.90 | 142 394.50 | 10.31% |
| 01.07.2018 | 1 581 530.40 | 1 545 217.10 | 36 313.30 | 2.35% | 1 359 966.70 | 221 563.70 | 16.29% |
| 01.04.2018 | 1 545 217.10 | 1 420 654.10 | 124 563.00 | 8.77% | 1 434 726.10 | 110 491.00 | 7.70% |
| 01.01.2018 | 1 420 654.10 | 1 380 512.90 | 40 141.20 | 2.91% | 1 563 052.20 | - 142 398.10 | -9.11% |
| 01.10.2017 | 1 380 512.90 | 1 359 966.70 | 20 546.20 | 1.51% | 1 692 589.30 | - 312 076.40 | -18.44% |
| 01.07.2017 | 1 359 966.70 | 1 434 726.10 | -74 759.40 | -5.21% | 1 843 542.90 | - 483 576.20 | -26.23% |
| 01.04.2017 | 1 434 726.10 | 1 563 052.20 | - 128 326.10 | -8.21% | 1 924 863.70 | - 490 137.60 | -25.46% |
| 01.01.2017 | 1 563 052.20 | 1 692 589.30 | - 129 537.10 | -7.65% | 1 964 554.20 | - 401 502.00 | -20.44% |
| 01.10.2016 | 1 692 589.30 | 1 843 542.90 | - 150 953.60 | -8.19% | 2 018 808.50 | - 326 219.20 | -16.16% |
| 01.07.2016 | 1 843 542.90 | 1 924 863.70 | -81 320.80 | -4.22% | 2 158 334.60 | - 314 791.70 | -14.58% |
| 01.04.2016 | 1 924 863.70 | 1 964 554.20 | -39 690.50 | -2.02% | 2 193 474.10 | - 268 610.40 | -12.25% |
| 01.01.2016 | 1 964 554.20 | 2 018 808.50 | -54 254.30 | -2.69% | 2 260 740.00 | - 296 185.80 | -13.10% |
| 01.10.2015 | 2 018 808.50 | 2 158 334.60 | - 139 526.10 | -6.46% | 2 275 069.90 | - 256 261.40 | -11.26% |
| 01.07.2015 | 2 158 334.60 | 2 193 474.10 | -35 139.50 | -1.60% | 2 250 506.60 | -92 172.00 | -4.10% |
| 01.04.2015 | 2 193 474.10 | 2 260 740.00 | -67 265.90 | -2.98% | 2 215 847.10 | -22 373.00 | -1.01% |
| 01.01.2015 | 2 260 740.00 | 2 275 069.90 | -14 329.90 | -0.63% | 2 175 056.50 | 85 683.50 | 3.94% |
| 01.10.2014 | 2 275 069.90 | 2 250 506.60 | 24 563.30 | 1.09% | 2 201 810.80 | 73 259.10 | 3.33% |
| 01.07.2014 | 2 250 506.60 | 2 215 847.10 | 34 659.50 | 1.56% | 2 227 769.80 | 22 736.80 | 1.02% |
| 01.04.2014 | 2 215 847.10 | 2 175 056.50 | 40 790.60 | 1.88% | 2 320 525.90 | - 104 678.80 | -4.51% |
| 01.01.2014 | 2 175 056.50 | 2 201 810.80 | -26 754.30 | -1.22% | 2 342 359.50 | - 167 303.00 | -7.14% |
| 01.10.2013 | 2 201 810.80 | 2 227 769.80 | -25 959.00 | -1.17% | 2 235 945.40 | -34 134.60 | -1.53% |
| 01.07.2013 | 2 227 769.80 | 2 320 525.90 | -92 756.10 | -4.00% | 2 223 578.70 | 4 191.10 | 0.19% |
| 01.04.2013 | 2 320 525.90 | 2 342 359.50 | -21 833.60 | -0.93% | 2 145 773.80 | 174 752.10 | 8.14% |
| 01.01.2013 | 2 342 359.50 | 2 235 945.40 | 106 414.10 | 4.76% | 2 064 634.80 | 277 724.70 | 13.45% |
| 01.10.2012 | 2 235 945.40 | 2 223 578.70 | 12 366.70 | 0.56% | 1 916 399.40 | 319 546.00 | 16.67% |
| 01.07.2012 | 2 223 578.70 | 2 145 773.80 | 77 804.90 | 3.63% | 1 871 667.20 | 351 911.50 | 18.80% |
| 01.04.2012 | 2 145 773.80 | 2 064 634.80 | 81 139.00 | 3.93% | 1 790 035.80 | 355 738.00 | 19.87% |
| 01.01.2012 | 2 064 634.80 | 1 916 399.40 | 148 235.40 | 7.74% | 1 769 775.30 | 294 859.50 | 16.66% |
| 01.10.2011 | 1 916 399.40 | 1 871 667.20 | 44 732.20 | 2.39% | 1 649 480.80 | 266 918.60 | 16.18% |
| 01.07.2011 | 1 871 667.20 | 1 790 035.80 | 81 631.40 | 4.56% | 1 732 501.30 | 139 165.90 | 8.03% |
| 01.04.2011 | 1 790 035.80 | 1 769 775.30 | 20 260.50 | 1.14% | 1 580 659.10 | 209 376.70 | 13.25% |
| 01.01.2011 | 1 769 775.30 | 1 649 480.80 | 120 294.50 | 7.29% | 1 519 455.50 | 250 319.80 | 16.47% |
| 01.10.2010 | 1 649 480.80 | 1 732 501.30 | -83 020.50 | -4.79% | 1 552 468.50 | 97 012.30 | 6.25% |
| 01.07.2010 | 1 732 501.30 | 1 580 659.10 | 151 842.20 | 9.61% | 1 507 993.30 | 224 508.00 | 14.89% |
| 01.04.2010 | 1 580 659.10 | 1 519 455.50 | 61 203.60 | 4.03% | 1 428 889.00 | 151 770.10 | 10.62% |
| 01.01.2010 | 1 519 455.50 | 1 552 468.50 | -33 013.00 | -2.13% | 1 300 131.60 | 219 323.90 | 16.87% |
| 01.10.2009 | 1 552 468.50 | 1 507 993.30 | 44 475.20 | 2.95% | 1 227 425.90 | 325 042.60 | 26.48% |
| 01.07.2009 | 1 507 993.30 | 1 428 889.00 | 79 104.30 | 5.54% | 1 047 324.80 | 460 668.50 | 43.99% |
| 01.04.2009 | 1 428 889.00 | 1 300 131.60 | 128 757.40 | 9.90% | 1 044 277.50 | 384 611.50 | 36.83% |
| 01.01.2009 | 1 300 131.60 | 1 227 425.90 | 72 705.70 | 5.92% | 1 093 850.00 | 206 281.60 | 18.86% |
| 01.10.2008 | 1 227 425.90 | 1 047 324.80 | 180 101.10 | 17.20% | 1 179 007.90 | 48 418.00 | 4.11% |
| 01.07.2008 | 1 047 324.80 | 1 044 277.50 | 3 047.30 | 0.29% | 1 149 978.30 | - 102 653.50 | -8.93% |
| 01.04.2008 | 1 044 277.50 | 1 093 850.00 | -49 572.50 | -4.53% | 1 161 471.40 | - 117 193.90 | -10.09% |
| 01.01.2008 | 1 093 850.00 | 1 179 007.90 | -85 157.90 | -7.22% | 1 150 713.50 | -56 863.50 | -4.94% |
| 01.10.2007 | 1 179 007.90 | 1 149 978.30 | 29 029.60 | 2.52% | 1 061 976.10 | 117 031.80 | 11.02% |
| 01.07.2007 | 1 149 978.30 | 1 161 471.40 | -11 493.10 | -0.99% | 1 043 387.80 | 106 590.50 | 10.22% |
| 01.04.2007 | 1 161 471.40 | 1 150 713.50 | 10 757.90 | 0.93% | 1 023 657.80 | 137 813.60 | 13.46% |
| 01.01.2007 | 1 150 713.50 | 1 061 976.10 | 88 737.40 | 8.36% | 982 582.70 | 168 130.80 | 17.11% |
| 01.10.2006 | 1 061 976.10 | 1 043 387.80 | 18 588.30 | 1.78% | 979 224.10 | 82 752.00 | 8.45% |
| 01.07.2006 | 1 043 387.80 | 1 023 657.80 | 19 730.00 | 1.93% | 987 694.10 | 55 693.70 | 5.64% |
| 01.04.2006 | 1 023 657.80 | 982 582.70 | 41 075.10 | 4.18% | 994 216.30 | 29 441.50 | 2.96% |
| 01.01.2006 | 982 582.70 | 979 224.10 | 3 358.60 | 0.34% | 991 625.00 | -9 042.30 | -0.91% |
| 01.10.2005 | 979 224.10 | 987 694.10 | -8 470.00 | -0.86% | 1 021 310.40 | -42 086.30 | -4.12% |
| 01.07.2005 | 987 694.10 | 994 216.30 | -6 522.20 | -0.66% | 1 119 910.00 | - 132 215.90 | -11.81% |
| 01.04.2005 | 994 216.30 | 991 625.00 | 2 591.30 | 0.26% | 1 139 920.50 | - 145 704.20 | -12.78% |
| 01.01.2005 | 991 625.00 | 1 021 310.40 | -29 685.40 | -2.91% | 1 126 393.00 | - 134 768.00 | -11.96% |
| 01.10.2004 | 1 021 310.40 | 1 119 910.00 | -98 599.60 | -8.80% | 985 354.30 | 35 956.10 | 3.65% |
| 01.07.2004 | 1 119 910.00 | 1 139 920.50 | -20 010.50 | -1.76% | 939 422.10 | 180 487.90 | 19.21% |
| 01.04.2004 | 1 139 920.50 | 1 126 393.00 | 13 527.50 | 1.20% | 873 282.90 | 266 637.60 | 30.53% |
| 01.01.2004 | 1 126 393.00 | 985 354.30 | 141 038.70 | 14.31% | 800 063.10 | 326 329.90 | 40.79% |
| 01.10.2003 | 985 354.30 | 939 422.10 | 45 932.20 | 4.89% | 784 539.00 | 200 815.30 | 25.60% |
| 01.07.2003 | 939 422.10 | 873 282.90 | 66 139.20 | 7.57% | 764 988.70 | 174 433.40 | 22.80% |
| 01.04.2003 | 873 282.90 | 800 063.10 | 73 219.80 | 9.15% | 706 837.80 | 166 445.10 | 23.55% |
| 01.01.2003 | 800 063.10 | 784 539.00 | 15 524.10 | 1.98% | 683 731.30 | 116 331.80 | 17.01% |
| 01.10.2002 | 784 539.00 | 764 988.70 | 19 550.30 | 2.56% | - | - | - |
| 01.07.2002 | 764 988.70 | 706 837.80 | 58 150.90 | 8.23% | - | - | - |
| 01.04.2002 | 706 837.80 | 683 731.30 | 23 106.50 | 3.38% | - | - | - |
| 01.01.2002 | 683 731.30 | - | - | - | - | - | - |
Podobné sestavy
Aplikace Ekonomika ČNB ze sekce makroekonomika zobrazuje časové řady hlavních makroekonomických údajů z ekonomiky ČR. Najdete zde přes 10.000 grafů různých hodnot od úrokových sazeb, přes statistiky státního rozpočtu, statistiky ČNB a data zpracovávaná ČSÚ. Data jsou k dispozici obvykle za posledních více než 20 let, od prosince roku 1992. Zdroj dat: ČNB ARAD

