Other assets (Levels»Bond Funds Balance Sheet) - ekonomika ČNB
Aktualizace dat Other assets (Levels»Bond Funds Balance Sheet) v této aplikaci skončila 30.6.2023. Aktualizovná data časových řad najdete na stránkách nové aplikace z dat ARAD ČNB
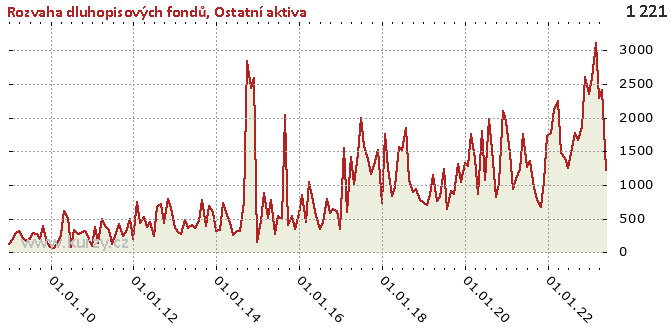
Graf hodnot, Bond Funds Balance Sheet
Meziroční srovnání
Minima a maxima
| Typ | Období | Hodnota |
|---|---|---|
| Max | 30.09.2014 | 2 841.68 |
| Min | 31.01.2010 | 56.92 |
Historické hodnoty
| Období | Hodnota | Předchozí | Rozdíl | Změna | Před rokem | Rozdíl | Změna |
|---|---|---|---|---|---|---|---|
| 30.06.2020 | 1 073.31 | 1 799.84 | - 726.53 | -40.37% | 1 230.49 | - 157.18 | -12.77% |
| 31.05.2020 | 1 799.84 | 872.00 | 927.84 | 106.40% | 827.11 | 972.73 | 117.61% |
| 30.04.2020 | 872.00 | 1 391.81 | - 519.81 | -37.35% | 756.35 | 115.65 | 15.29% |
| 31.03.2020 | 1 391.81 | 1 758.16 | - 366.35 | -20.84% | 1 148.75 | 243.06 | 21.16% |
| 29.02.2020 | 1 758.16 | 1 285.07 | 473.10 | 36.81% | 843.07 | 915.09 | 108.54% |
| 31.01.2020 | 1 285.07 | 1 329.63 | -44.56 | -3.35% | 698.85 | 586.21 | 83.88% |
| 31.12.2019 | 1 329.63 | 1 044.55 | 285.08 | 27.29% | 747.27 | 582.36 | 77.93% |
| 30.11.2019 | 1 044.55 | 1 310.43 | - 265.88 | -20.29% | 773.47 | 271.08 | 35.05% |
| 31.10.2019 | 1 310.43 | 872.36 | 438.07 | 50.22% | 946.37 | 364.06 | 38.47% |
| 30.09.2019 | 872.36 | 911.83 | -39.47 | -4.33% | 897.38 | -25.02 | -2.79% |
| 31.08.2019 | 911.83 | 641.63 | 270.20 | 42.11% | 1 071.43 | - 159.60 | -14.90% |
| 31.07.2019 | 641.63 | 1 230.49 | - 588.86 | -47.86% | 1 839.66 | -1 198.03 | -65.12% |
| 30.06.2019 | 1 230.49 | 827.11 | 403.38 | 48.77% | 1 517.28 | - 286.79 | -18.90% |
| 31.05.2019 | 827.11 | 756.35 | 70.77 | 9.36% | 1 567.03 | - 739.91 | -47.22% |
| 30.04.2019 | 756.35 | 1 148.75 | - 392.40 | -34.16% | 970.84 | - 214.49 | -22.09% |
| 31.03.2019 | 1 148.75 | 843.07 | 305.68 | 36.26% | 834.29 | 314.46 | 37.69% |
| 28.02.2019 | 843.07 | 698.85 | 144.22 | 20.64% | 1 253.59 | - 410.52 | -32.75% |
| 31.01.2019 | 698.85 | 747.27 | -48.41 | -6.48% | 1 763.68 | -1 064.83 | -60.38% |
| 31.12.2018 | 747.27 | 773.47 | -26.20 | -3.39% | 738.35 | 8.92 | 1.21% |
| 30.11.2018 | 773.47 | 946.37 | - 172.90 | -18.27% | 1 514.41 | - 740.94 | -48.93% |
| 31.10.2018 | 946.37 | 897.38 | 48.99 | 5.46% | 1 333.75 | - 387.38 | -29.04% |
| 30.09.2018 | 897.38 | 1 071.43 | - 174.05 | -16.24% | 1 166.43 | - 269.05 | -23.07% |
| 31.08.2018 | 1 071.43 | 1 839.66 | - 768.24 | -41.76% | 1 392.57 | - 321.15 | -23.06% |
| 31.07.2018 | 1 839.66 | 1 517.28 | 322.39 | 21.25% | 1 574.57 | 265.09 | 16.84% |
| 30.06.2018 | 1 517.28 | 1 567.03 | -49.75 | -3.17% | 1 988.32 | - 471.05 | -23.69% |
| 31.05.2018 | 1 567.03 | 970.84 | 596.18 | 61.41% | 1 456.79 | 110.23 | 7.57% |
| 30.04.2018 | 970.84 | 834.29 | 136.55 | 16.37% | 1 006.93 | -36.09 | -3.58% |
| 31.03.2018 | 834.29 | 1 253.59 | - 419.30 | -33.45% | 1 409.24 | - 574.94 | -40.80% |
| 28.02.2018 | 1 253.59 | 1 763.68 | - 510.09 | -28.92% | 594.93 | 658.66 | 110.71% |
| 31.01.2018 | 1 763.68 | 738.35 | 1 025.33 | 138.87% | 1 552.69 | 210.99 | 13.59% |
| 31.12.2017 | 738.35 | 1 514.41 | - 776.06 | -51.24% | 338.27 | 400.08 | 118.27% |
| 30.11.2017 | 1 514.41 | 1 333.75 | 180.66 | 13.55% | 617.12 | 897.29 | 145.40% |
| 31.10.2017 | 1 333.75 | 1 166.43 | 167.32 | 14.34% | 645.71 | 688.04 | 106.56% |
| 30.09.2017 | 1 166.43 | 1 392.57 | - 226.15 | -16.24% | 576.98 | 589.45 | 102.16% |
| 31.08.2017 | 1 392.57 | 1 574.57 | - 182.00 | -11.56% | 798.21 | 594.36 | 74.46% |
| 31.07.2017 | 1 574.57 | 1 988.32 | - 413.75 | -20.81% | 429.14 | 1 145.43 | 266.91% |
| 30.06.2017 | 1 988.32 | 1 456.79 | 531.53 | 36.49% | 348.00 | 1 640.33 | 471.36% |
| 31.05.2017 | 1 456.79 | 1 006.93 | 449.87 | 44.68% | 541.74 | 915.06 | 168.91% |
| 30.04.2017 | 1 006.93 | 1 409.24 | - 402.31 | -28.55% | 767.77 | 239.16 | 31.15% |
| 31.03.2017 | 1 409.24 | 594.93 | 814.30 | 136.87% | 1 039.97 | 369.26 | 35.51% |
| 28.02.2017 | 594.93 | 1 552.69 | - 957.76 | -61.68% | 455.35 | 139.58 | 30.65% |
| 31.01.2017 | 1 552.69 | 338.27 | 1 214.42 | 359.01% | 849.79 | 702.90 | 82.71% |
| 31.12.2016 | 338.27 | 617.12 | - 278.85 | -45.19% | 572.47 | - 234.20 | -40.91% |
| 30.11.2016 | 617.12 | 645.71 | -28.59 | -4.43% | 345.31 | 271.81 | 78.72% |
| 31.10.2016 | 645.71 | 576.98 | 68.73 | 11.91% | 542.99 | 102.72 | 18.92% |
| 30.09.2016 | 576.98 | 798.21 | - 221.24 | -27.72% | 405.13 | 171.85 | 42.42% |
| 31.08.2016 | 798.21 | 429.14 | 369.07 | 86.00% | 2 037.72 | -1 239.51 | -60.83% |
| 31.07.2016 | 429.14 | 348.00 | 81.14 | 23.32% | 498.23 | -69.09 | -13.87% |
| 30.06.2016 | 348.00 | 541.74 | - 193.74 | -35.76% | 543.30 | - 195.30 | -35.95% |
| 31.05.2016 | 541.74 | 767.77 | - 226.04 | -29.44% | 274.51 | 267.22 | 97.34% |
| 30.04.2016 | 767.77 | 1 039.97 | - 272.20 | -26.17% | 776.48 | -8.71 | -1.12% |
| 31.03.2016 | 1 039.97 | 455.35 | 584.62 | 128.39% | 511.71 | 528.26 | 103.23% |
| 29.02.2016 | 455.35 | 849.79 | - 394.44 | -46.42% | 881.50 | - 426.15 | -48.34% |
| 31.01.2016 | 849.79 | 572.47 | 277.32 | 48.44% | 468.32 | 381.48 | 81.46% |
| 31.12.2015 | 572.47 | 345.31 | 227.16 | 65.79% | 147.70 | 424.77 | 287.60% |
| 30.11.2015 | 345.31 | 542.99 | - 197.68 | -36.41% | 2 583.61 | -2 238.30 | -86.63% |
| 31.10.2015 | 542.99 | 405.13 | 137.86 | 34.03% | 2 435.72 | -1 892.72 | -77.71% |
| 30.09.2015 | 405.13 | 2 037.72 | -1 632.59 | -80.12% | 2 841.68 | -2 436.55 | -85.74% |
| 31.08.2015 | 2 037.72 | 498.23 | 1 539.49 | 308.99% | 742.11 | 1 295.61 | 174.58% |
| 31.07.2015 | 498.23 | 543.30 | -45.07 | -8.30% | 322.88 | 175.35 | 54.31% |
| 30.06.2015 | 543.30 | 274.51 | 268.79 | 97.91% | 321.69 | 221.61 | 68.89% |
| 31.05.2015 | 274.51 | 776.48 | - 501.96 | -64.65% | 253.42 | 21.10 | 8.32% |
| 30.04.2015 | 776.48 | 511.71 | 264.77 | 51.74% | 438.47 | 338.01 | 77.09% |
| 31.03.2015 | 511.71 | 881.50 | - 369.79 | -41.95% | 595.95 | -84.24 | -14.14% |
| 28.02.2015 | 881.50 | 468.32 | 413.19 | 88.23% | 725.95 | 155.55 | 21.43% |
| 31.01.2015 | 468.32 | 147.70 | 320.62 | 217.08% | 330.80 | 137.51 | 41.57% |
| 31.12.2014 | 147.70 | 2 583.61 | -2 435.91 | -94.28% | 317.60 | - 169.91 | -53.50% |
| 30.11.2014 | 2 583.61 | 2 435.72 | 147.89 | 6.07% | 598.53 | 1 985.08 | 331.66% |
| 31.10.2014 | 2 435.72 | 2 841.68 | - 405.96 | -14.29% | 686.24 | 1 749.48 | 254.94% |
| 30.09.2014 | 2 841.68 | 742.11 | 2 099.57 | 282.92% | 387.43 | 2 454.25 | 633.47% |
| 31.08.2014 | 742.11 | 322.88 | 419.23 | 129.84% | 781.43 | -39.31 | -5.03% |
| 31.07.2014 | 322.88 | 321.69 | 1.19 | 0.37% | 457.58 | - 134.70 | -29.44% |
| 30.06.2014 | 321.69 | 253.42 | 68.28 | 26.94% | 366.56 | -44.87 | -12.24% |
| 31.05.2014 | 253.42 | 438.47 | - 185.05 | -42.20% | 408.69 | - 155.28 | -37.99% |
| 30.04.2014 | 438.47 | 595.95 | - 157.48 | -26.43% | 358.69 | 79.78 | 22.24% |
| 31.03.2014 | 595.95 | 725.95 | - 130.00 | -17.91% | 482.60 | 113.35 | 23.49% |
| 28.02.2014 | 725.95 | 330.80 | 395.15 | 119.45% | 264.60 | 461.35 | 174.36% |
| 31.01.2014 | 330.80 | 317.60 | 13.20 | 4.16% | 295.43 | 35.38 | 11.98% |
| 31.12.2013 | 317.60 | 598.53 | - 280.93 | -46.94% | 360.18 | -42.58 | -11.82% |
| 30.11.2013 | 598.53 | 686.24 | -87.71 | -12.78% | 656.79 | -58.26 | -8.87% |
| 31.10.2013 | 686.24 | 387.43 | 298.81 | 77.13% | 791.87 | - 105.63 | -13.34% |
| 30.09.2013 | 387.43 | 781.43 | - 394.00 | -50.42% | 433.32 | -45.89 | -10.59% |
| 31.08.2013 | 781.43 | 457.58 | 323.85 | 70.78% | 715.17 | 66.25 | 9.26% |
| 31.07.2013 | 457.58 | 366.56 | 91.02 | 24.83% | 673.66 | - 216.08 | -32.08% |
| 30.06.2013 | 366.56 | 408.69 | -42.13 | -10.31% | 236.30 | 130.26 | 55.13% |
| 31.05.2013 | 408.69 | 358.69 | 50.00 | 13.94% | 452.35 | -43.65 | -9.65% |
| 30.04.2013 | 358.69 | 482.60 | - 123.91 | -25.68% | 371.44 | -12.75 | -3.43% |
| 31.03.2013 | 482.60 | 264.60 | 218.00 | 82.39% | 519.67 | -37.07 | -7.13% |
| 28.02.2013 | 264.60 | 295.43 | -30.83 | -10.43% | 441.30 | - 176.70 | -40.04% |
| 31.01.2013 | 295.43 | 360.18 | -64.75 | -17.98% | 740.71 | - 445.29 | -60.12% |
| 31.12.2012 | 360.18 | 656.79 | - 296.61 | -45.16% | 196.02 | 164.16 | 83.74% |
| 30.11.2012 | 656.79 | 791.87 | - 135.08 | -17.06% | 489.79 | 167.00 | 34.10% |
| 31.10.2012 | 791.87 | 433.32 | 358.54 | 82.74% | 297.72 | 494.15 | 165.98% |
| 30.09.2012 | 433.32 | 715.17 | - 281.85 | -39.41% | 237.51 | 195.81 | 82.44% |
| 31.08.2012 | 715.17 | 673.66 | 41.52 | 6.16% | 419.51 | 295.66 | 70.48% |
| 31.07.2012 | 673.66 | 236.30 | 437.36 | 185.09% | 284.34 | 389.32 | 136.92% |
| 30.06.2012 | 236.30 | 452.35 | - 216.04 | -47.76% | 129.73 | 106.57 | 82.15% |
| 31.05.2012 | 452.35 | 371.44 | 80.91 | 21.78% | 336.56 | 115.79 | 34.40% |
| 30.04.2012 | 371.44 | 519.67 | - 148.23 | -28.52% | 396.35 | -24.91 | -6.29% |
| 31.03.2012 | 519.67 | 441.30 | 78.37 | 17.76% | 495.72 | 23.95 | 4.83% |
| 29.02.2012 | 441.30 | 740.71 | - 299.42 | -40.42% | 139.80 | 301.50 | 215.67% |
| 31.01.2012 | 740.71 | 196.02 | 544.69 | 277.87% | 369.58 | 371.13 | 100.42% |
| 31.12.2011 | 196.02 | 489.79 | - 293.76 | -59.98% | 98.08 | 97.94 | 99.86% |
| 30.11.2011 | 489.79 | 297.72 | 192.07 | 64.51% | 236.09 | 253.70 | 107.46% |
| 31.10.2011 | 297.72 | 237.51 | 60.21 | 25.35% | 311.34 | -13.62 | -4.37% |
| 30.09.2011 | 237.51 | 419.51 | - 182.00 | -43.38% | 285.76 | -48.25 | -16.88% |
| 31.08.2011 | 419.51 | 284.34 | 135.17 | 47.54% | 275.17 | 144.34 | 52.46% |
| 31.07.2011 | 284.34 | 129.73 | 154.61 | 119.18% | 327.30 | -42.96 | -13.13% |
| 30.06.2011 | 129.73 | 336.56 | - 206.83 | -61.45% | 78.38 | 51.35 | 65.52% |
| 31.05.2011 | 336.56 | 396.35 | -59.79 | -15.09% | 503.87 | - 167.31 | -33.21% |
| 30.04.2011 | 396.35 | 495.72 | -99.37 | -20.05% | 611.25 | - 214.90 | -35.16% |
| 31.03.2011 | 495.72 | 139.80 | 355.92 | 254.60% | 256.82 | 238.91 | 93.03% |
| 28.02.2011 | 139.80 | 369.58 | - 229.78 | -62.17% | 115.27 | 24.53 | 21.28% |
| 31.01.2011 | 369.58 | 98.08 | 271.50 | 276.81% | 56.92 | 312.66 | 549.34% |
| 31.12.2010 | 98.08 | 236.09 | - 138.00 | -58.45% | 71.61 | 26.48 | 36.98% |
| 30.11.2010 | 236.09 | 311.34 | -75.25 | -24.17% | 140.30 | 95.79 | 68.27% |
| 31.10.2010 | 311.34 | 285.76 | 25.58 | 8.95% | 392.47 | -81.13 | -20.67% |
| 30.09.2010 | 285.76 | 275.17 | 10.59 | 3.85% | 200.80 | 84.96 | 42.31% |
| 31.08.2010 | 275.17 | 327.30 | -52.13 | -15.93% | 275.82 | -0.66 | -0.24% |
| 31.07.2010 | 327.30 | 78.38 | 248.93 | 317.61% | 290.22 | 37.08 | 12.78% |
| 30.06.2010 | 78.38 | 503.87 | - 425.50 | -84.45% | 201.06 | - 122.69 | -61.02% |
| 31.05.2010 | 503.87 | 611.25 | - 107.38 | -17.57% | 162.54 | 341.33 | 210.00% |
| 30.04.2010 | 611.25 | 256.82 | 354.43 | 138.01% | 217.50 | 393.75 | 181.03% |
| 31.03.2010 | 256.82 | 115.27 | 141.55 | 122.80% | 312.47 | -55.65 | -17.81% |
| 28.02.2010 | 115.27 | 56.92 | 58.35 | 102.52% | 281.70 | - 166.44 | -59.08% |
| 31.01.2010 | 56.92 | 71.61 | -14.69 | -20.51% | 203.44 | - 146.53 | -72.02% |
| 31.12.2009 | 71.61 | 140.30 | -68.69 | -48.96% | 117.17 | -45.56 | -38.89% |
| 30.11.2009 | 140.30 | 392.47 | - 252.17 | -64.25% | - | - | - |
| 31.10.2009 | 392.47 | 200.80 | 191.67 | 95.45% | - | - | - |
| 30.09.2009 | 200.80 | 275.82 | -75.03 | -27.20% | - | - | - |
| 31.08.2009 | 275.82 | 290.22 | -14.40 | -4.96% | - | - | - |
| 31.07.2009 | 290.22 | 201.06 | 89.16 | 44.34% | - | - | - |
| 30.06.2009 | 201.06 | 162.54 | 38.52 | 23.70% | - | - | - |
| 31.05.2009 | 162.54 | 217.50 | -54.96 | -25.27% | - | - | - |
| 30.04.2009 | 217.50 | 312.47 | -94.97 | -30.39% | - | - | - |
| 31.03.2009 | 312.47 | 281.70 | 30.77 | 10.92% | - | - | - |
| 28.02.2009 | 281.70 | 203.44 | 78.26 | 38.47% | - | - | - |
| 31.01.2009 | 203.44 | 117.17 | 86.28 | 73.63% | - | - | - |
| 31.12.2008 | 117.17 | - | - | - | - | - | - |
Graf jako obrázek

Podobné sestavy
Aplikace Ekonomika ČNB ze sekce makroekonomika zobrazuje časové řady hlavních makroekonomických údajů z ekonomiky ČR. Najdete zde přes 10.000 grafů různých hodnot od úrokových sazeb, přes statistiky státního rozpočtu, statistiky ČNB a data zpracovávaná ČSÚ. Data jsou k dispozici obvykle za posledních více než 20 let, od prosince roku 1992. Zdroj dat: ČNB ARAD

