Other professional, scientific and technical activities - ekonomika ČNB
Aktualizace dat Other professional, scientific and technical activities v této aplikaci skončila 30.6.2023. Aktualizovná data časových řad najdete na stránkách nové aplikace z dat ARAD ČNB
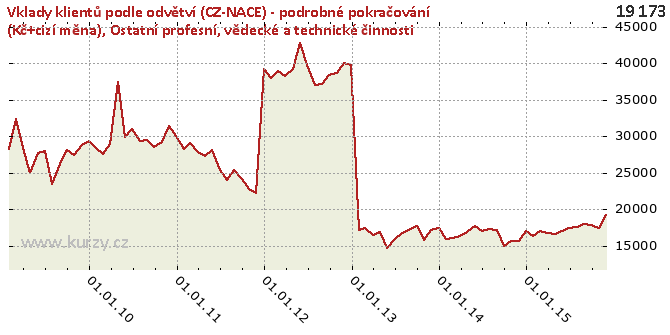
Graf hodnot, Client deposits by branches (CZ-NACE) - detailed_continuation (CZK+FC)
Meziroční srovnání
Minima a maxima
| Typ | Období | Hodnota |
|---|---|---|
| Min | 31.05.2013 | 14 645.60 |
| Max | 31.05.2012 | 42 826.30 |
Historické hodnoty
| Období | Hodnota | Předchozí | Rozdíl | Změna | Před rokem | Rozdíl | Změna |
|---|---|---|---|---|---|---|---|
| 30.11.2015 | 19 173.50 | 17 484.30 | 1 689.20 | 9.66% | 15 602.00 | 3 571.50 | 22.89% |
| 31.10.2015 | 17 484.30 | 17 881.30 | - 397.00 | -2.22% | 15 593.80 | 1 890.50 | 12.12% |
| 30.09.2015 | 17 881.30 | 17 923.10 | -41.80 | -0.23% | 14 968.60 | 2 912.70 | 19.46% |
| 31.08.2015 | 17 923.10 | 17 629.60 | 293.50 | 1.66% | 17 178.50 | 744.60 | 4.33% |
| 31.07.2015 | 17 629.60 | 17 408.10 | 221.50 | 1.27% | 17 302.50 | 327.10 | 1.89% |
| 30.06.2015 | 17 408.10 | 17 003.80 | 404.30 | 2.38% | 17 061.70 | 346.40 | 2.03% |
| 31.05.2015 | 17 003.80 | 16 661.90 | 341.90 | 2.05% | 17 716.80 | - 713.00 | -4.02% |
| 30.04.2015 | 16 661.90 | 16 763.90 | - 102.00 | -0.61% | 16 847.20 | - 185.30 | -1.10% |
| 31.03.2015 | 16 763.90 | 17 008.00 | - 244.10 | -1.44% | 16 319.80 | 444.10 | 2.72% |
| 28.02.2015 | 17 008.00 | 16 304.60 | 703.40 | 4.31% | 16 078.30 | 929.70 | 5.78% |
| 31.01.2015 | 16 304.60 | 17 096.20 | - 791.60 | -4.63% | 15 999.60 | 305.00 | 1.91% |
| 31.12.2014 | 17 096.20 | 15 602.00 | 1 494.20 | 9.58% | 17 473.90 | - 377.70 | -2.16% |
| 30.11.2014 | 15 602.00 | 15 593.80 | 8.20 | 0.05% | 17 106.50 | -1 504.50 | -8.79% |
| 31.10.2014 | 15 593.80 | 14 968.60 | 625.20 | 4.18% | 15 803.10 | - 209.30 | -1.32% |
| 30.09.2014 | 14 968.60 | 17 178.50 | -2 209.90 | -12.86% | 17 670.00 | -2 701.40 | -15.29% |
| 31.08.2014 | 17 178.50 | 17 302.50 | - 124.00 | -0.72% | 17 113.70 | 64.80 | 0.38% |
| 31.07.2014 | 17 302.50 | 17 061.70 | 240.80 | 1.41% | 16 787.60 | 514.90 | 3.07% |
| 30.06.2014 | 17 061.70 | 17 716.80 | - 655.10 | -3.70% | 15 972.10 | 1 089.60 | 6.82% |
| 31.05.2014 | 17 716.80 | 16 847.20 | 869.60 | 5.16% | 14 645.60 | 3 071.20 | 20.97% |
| 30.04.2014 | 16 847.20 | 16 319.80 | 527.40 | 3.23% | 16 923.20 | -76.00 | -0.45% |
| 31.03.2014 | 16 319.80 | 16 078.30 | 241.50 | 1.50% | 16 467.20 | - 147.40 | -0.90% |
| 28.02.2014 | 16 078.30 | 15 999.60 | 78.70 | 0.49% | 17 435.40 | -1 357.10 | -7.78% |
| 31.01.2014 | 15 999.60 | 17 473.90 | -1 474.30 | -8.44% | 17 116.10 | -1 116.50 | -6.52% |
| 31.12.2013 | 17 473.90 | 17 106.50 | 367.40 | 2.15% | 39 773.90 | -22 300.00 | -56.07% |
| 30.11.2013 | 17 106.50 | 15 803.10 | 1 303.40 | 8.25% | 40 014.70 | -22 908.20 | -57.25% |
| 31.10.2013 | 15 803.10 | 17 670.00 | -1 866.90 | -10.57% | 38 652.30 | -22 849.20 | -59.11% |
| 30.09.2013 | 17 670.00 | 17 113.70 | 556.30 | 3.25% | 38 354.10 | -20 684.10 | -53.93% |
| 31.08.2013 | 17 113.70 | 16 787.60 | 326.10 | 1.94% | 37 174.90 | -20 061.20 | -53.96% |
| 31.07.2013 | 16 787.60 | 15 972.10 | 815.50 | 5.11% | 37 034.70 | -20 247.10 | -54.67% |
| 30.06.2013 | 15 972.10 | 14 645.60 | 1 326.50 | 9.06% | 39 814.30 | -23 842.20 | -59.88% |
| 31.05.2013 | 14 645.60 | 16 923.20 | -2 277.60 | -13.46% | 42 826.30 | -28 180.70 | -65.80% |
| 30.04.2013 | 16 923.20 | 16 467.20 | 456.00 | 2.77% | 39 204.00 | -22 280.80 | -56.83% |
| 31.03.2013 | 16 467.20 | 17 435.40 | - 968.20 | -5.55% | 38 298.30 | -21 831.10 | -57.00% |
| 28.02.2013 | 17 435.40 | 17 116.10 | 319.30 | 1.87% | 38 915.40 | -21 480.00 | -55.20% |
| 31.01.2013 | 17 116.10 | 39 773.90 | -22 657.80 | -56.97% | 37 990.80 | -20 874.70 | -54.95% |
| 31.12.2012 | 39 773.90 | 40 014.70 | - 240.80 | -0.60% | 39 261.00 | 512.90 | 1.31% |
| 30.11.2012 | 40 014.70 | 38 652.30 | 1 362.40 | 3.52% | 22 237.80 | 17 776.90 | 79.94% |
| 31.10.2012 | 38 652.30 | 38 354.10 | 298.20 | 0.78% | 22 713.30 | 15 939.00 | 70.17% |
| 30.09.2012 | 38 354.10 | 37 174.90 | 1 179.20 | 3.17% | 24 192.20 | 14 161.90 | 58.54% |
| 31.08.2012 | 37 174.90 | 37 034.70 | 140.20 | 0.38% | 25 407.20 | 11 767.70 | 46.32% |
| 31.07.2012 | 37 034.70 | 39 814.30 | -2 779.60 | -6.98% | 23 965.20 | 13 069.50 | 54.54% |
| 30.06.2012 | 39 814.30 | 42 826.30 | -3 012.00 | -7.03% | 25 368.00 | 14 446.30 | 56.95% |
| 31.05.2012 | 42 826.30 | 39 204.00 | 3 622.30 | 9.24% | 28 102.40 | 14 723.90 | 52.39% |
| 30.04.2012 | 39 204.00 | 38 298.30 | 905.70 | 2.36% | 27 241.30 | 11 962.70 | 43.91% |
| 31.03.2012 | 38 298.30 | 38 915.40 | - 617.10 | -1.59% | 27 842.40 | 10 455.90 | 37.55% |
| 29.02.2012 | 38 915.40 | 37 990.80 | 924.60 | 2.43% | 29 076.10 | 9 839.30 | 33.84% |
| 31.01.2012 | 37 990.80 | 39 261.00 | -1 270.20 | -3.24% | 28 293.40 | 9 697.40 | 34.27% |
| 31.12.2011 | 39 261.00 | 22 237.80 | 17 023.20 | 76.55% | 30 046.10 | 9 214.90 | 30.67% |
| 30.11.2011 | 22 237.80 | 22 713.30 | - 475.50 | -2.09% | 31 463.00 | -9 225.20 | -29.32% |
| 31.10.2011 | 22 713.30 | 24 192.20 | -1 478.90 | -6.11% | 29 235.70 | -6 522.40 | -22.31% |
| 30.09.2011 | 24 192.20 | 25 407.20 | -1 215.00 | -4.78% | 28 528.50 | -4 336.30 | -15.20% |
| 31.08.2011 | 25 407.20 | 23 965.20 | 1 442.00 | 6.02% | 29 425.40 | -4 018.20 | -13.66% |
| 31.07.2011 | 23 965.20 | 25 368.00 | -1 402.80 | -5.53% | 29 296.20 | -5 331.00 | -18.20% |
| 30.06.2011 | 25 368.00 | 28 102.40 | -2 734.40 | -9.73% | 30 934.10 | -5 566.10 | -17.99% |
| 31.05.2011 | 28 102.40 | 27 241.30 | 861.10 | 3.16% | 29 862.80 | -1 760.40 | -5.89% |
| 30.04.2011 | 27 241.30 | 27 842.40 | - 601.10 | -2.16% | 37 428.40 | -10 187.10 | -27.22% |
| 31.03.2011 | 27 842.40 | 29 076.10 | -1 233.70 | -4.24% | 28 879.40 | -1 037.00 | -3.59% |
| 28.02.2011 | 29 076.10 | 28 293.40 | 782.70 | 2.77% | 27 503.80 | 1 572.30 | 5.72% |
| 31.01.2011 | 28 293.40 | 30 046.10 | -1 752.70 | -5.83% | 28 398.90 | - 105.50 | -0.37% |
| 31.12.2010 | 30 046.10 | 31 463.00 | -1 416.90 | -4.50% | 29 386.60 | 659.50 | 2.24% |
| 30.11.2010 | 31 463.00 | 29 235.70 | 2 227.30 | 7.62% | 28 755.20 | 2 707.80 | 9.42% |
| 31.10.2010 | 29 235.70 | 28 528.50 | 707.20 | 2.48% | 27 404.40 | 1 831.30 | 6.68% |
| 30.09.2010 | 28 528.50 | 29 425.40 | - 896.90 | -3.05% | 28 123.00 | 405.50 | 1.44% |
| 31.08.2010 | 29 425.40 | 29 296.20 | 129.20 | 0.44% | 26 156.70 | 3 268.70 | 12.50% |
| 31.07.2010 | 29 296.20 | 30 934.10 | -1 637.90 | -5.29% | 23 455.30 | 5 840.90 | 24.90% |
| 30.06.2010 | 30 934.10 | 29 862.80 | 1 071.30 | 3.59% | 27 926.80 | 3 007.30 | 10.77% |
| 31.05.2010 | 29 862.80 | 37 428.40 | -7 565.60 | -20.21% | 27 705.50 | 2 157.30 | 7.79% |
| 30.04.2010 | 37 428.40 | 28 879.40 | 8 549.00 | 29.60% | 24 929.40 | 12 499.00 | 50.14% |
| 31.03.2010 | 28 879.40 | 27 503.80 | 1 375.60 | 5.00% | 28 346.50 | 532.90 | 1.88% |
| 28.02.2010 | 27 503.80 | 28 398.90 | - 895.10 | -3.15% | 32 371.90 | -4 868.10 | -15.04% |
| 31.01.2010 | 28 398.90 | 29 386.60 | - 987.70 | -3.36% | 28 268.20 | 130.70 | 0.46% |
| 31.12.2009 | 29 386.60 | 28 755.20 | 631.40 | 2.20% | - | - | - |
| 30.11.2009 | 28 755.20 | 27 404.40 | 1 350.80 | 4.93% | - | - | - |
| 31.10.2009 | 27 404.40 | 28 123.00 | - 718.60 | -2.56% | - | - | - |
| 30.09.2009 | 28 123.00 | 26 156.70 | 1 966.30 | 7.52% | - | - | - |
| 31.08.2009 | 26 156.70 | 23 455.30 | 2 701.40 | 11.52% | - | - | - |
| 31.07.2009 | 23 455.30 | 27 926.80 | -4 471.50 | -16.01% | - | - | - |
| 30.06.2009 | 27 926.80 | 27 705.50 | 221.30 | 0.80% | - | - | - |
| 31.05.2009 | 27 705.50 | 24 929.40 | 2 776.10 | 11.14% | - | - | - |
| 30.04.2009 | 24 929.40 | 28 346.50 | -3 417.10 | -12.05% | - | - | - |
| 31.03.2009 | 28 346.50 | 32 371.90 | -4 025.40 | -12.43% | - | - | - |
| 28.02.2009 | 32 371.90 | 28 268.20 | 4 103.70 | 14.52% | - | - | - |
| 31.01.2009 | 28 268.20 | - | - | - | - | - | - |
Graf jako obrázek

Podobné sestavy
Aplikace Ekonomika ČNB ze sekce makroekonomika zobrazuje časové řady hlavních makroekonomických údajů z ekonomiky ČR. Najdete zde přes 10.000 grafů různých hodnot od úrokových sazeb, přes statistiky státního rozpočtu, statistiky ČNB a data zpracovávaná ČSÚ. Data jsou k dispozici obvykle za posledních více než 20 let, od prosince roku 1992. Zdroj dat: ČNB ARAD

