Manufacture of rubber and plastic products - ekonomika ČNB
Aktualizace dat Manufacture of rubber and plastic products v této aplikaci skončila 30.6.2023. Aktualizovná data časových řad najdete na stránkách nové aplikace z dat ARAD ČNB
Nové časové řady makroekonomiky a jejich data
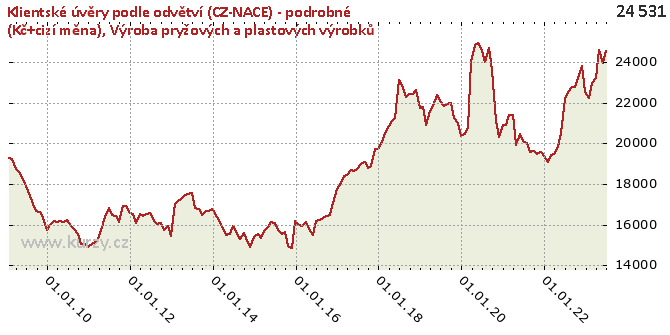
Graf hodnot, Client loans by branches (CZ-NACE) - detailed (CZK+FC)
Meziroční srovnání
Minima a maxima
| Typ | Období | Hodnota |
|---|---|---|
| Max | 31.05.2020 | 24 956.00 |
| Min | 30.11.2015 | 14 838.10 |
Historické hodnoty
| Období | Hodnota | Předchozí | Rozdíl | Změna | Před rokem | Rozdíl | Změna |
|---|---|---|---|---|---|---|---|
| 31.07.2020 | 23 989.00 | 24 520.50 | - 531.50 | -2.17% | 21 835.70 | 2 153.30 | 9.86% |
| 30.06.2020 | 24 520.50 | 24 956.00 | - 435.50 | -1.75% | 22 071.60 | 2 448.90 | 11.10% |
| 31.05.2020 | 24 956.00 | 24 860.40 | 95.60 | 0.38% | 22 372.70 | 2 583.30 | 11.55% |
| 30.04.2020 | 24 860.40 | 24 021.70 | 838.70 | 3.49% | 21 822.90 | 3 037.50 | 13.92% |
| 31.03.2020 | 24 021.70 | 20 781.70 | 3 240.00 | 15.59% | 21 610.00 | 2 411.70 | 11.16% |
| 29.02.2020 | 20 781.70 | 20 438.70 | 343.00 | 1.68% | 20 894.80 | - 113.10 | -0.54% |
| 31.01.2020 | 20 438.70 | 20 351.10 | 87.60 | 0.43% | 21 811.40 | -1 372.70 | -6.29% |
| 31.12.2019 | 20 351.10 | 21 017.30 | - 666.20 | -3.17% | 21 719.80 | -1 368.70 | -6.30% |
| 30.11.2019 | 21 017.30 | 21 246.70 | - 229.40 | -1.08% | 22 625.70 | -1 608.40 | -7.11% |
| 31.10.2019 | 21 246.70 | 22 004.70 | - 758.00 | -3.44% | 22 433.80 | -1 187.10 | -5.29% |
| 30.09.2019 | 22 004.70 | 21 929.50 | 75.20 | 0.34% | 22 415.00 | - 410.30 | -1.83% |
| 31.08.2019 | 21 929.50 | 21 835.70 | 93.80 | 0.43% | 22 272.50 | - 343.00 | -1.54% |
| 31.07.2019 | 21 835.70 | 22 071.60 | - 235.90 | -1.07% | 22 881.80 | -1 046.10 | -4.57% |
| 30.06.2019 | 22 071.60 | 22 372.70 | - 301.10 | -1.35% | 23 128.60 | -1 057.00 | -4.57% |
| 31.05.2019 | 22 372.70 | 21 822.90 | 549.80 | 2.52% | 21 266.10 | 1 106.60 | 5.20% |
| 30.04.2019 | 21 822.90 | 21 610.00 | 212.90 | 0.99% | 21 088.00 | 734.90 | 3.48% |
| 31.03.2019 | 21 610.00 | 20 894.80 | 715.20 | 3.42% | 20 879.10 | 730.90 | 3.50% |
| 28.02.2019 | 20 894.80 | 21 811.40 | - 916.60 | -4.20% | 20 502.30 | 392.50 | 1.91% |
| 31.01.2019 | 21 811.40 | 21 719.80 | 91.60 | 0.42% | 20 075.70 | 1 735.70 | 8.65% |
| 31.12.2018 | 21 719.80 | 22 625.70 | - 905.90 | -4.00% | 19 737.10 | 1 982.70 | 10.05% |
| 30.11.2018 | 22 625.70 | 22 433.80 | 191.90 | 0.86% | 19 724.80 | 2 900.90 | 14.71% |
| 31.10.2018 | 22 433.80 | 22 415.00 | 18.80 | 0.08% | 18 890.30 | 3 543.50 | 18.76% |
| 30.09.2018 | 22 415.00 | 22 272.50 | 142.50 | 0.64% | 18 782.30 | 3 632.70 | 19.34% |
| 31.08.2018 | 22 272.50 | 22 881.80 | - 609.30 | -2.66% | 19 084.50 | 3 188.00 | 16.70% |
| 31.07.2018 | 22 881.80 | 23 128.60 | - 246.80 | -1.07% | 19 010.50 | 3 871.30 | 20.36% |
| 30.06.2018 | 23 128.60 | 21 266.10 | 1 862.50 | 8.76% | 18 737.40 | 4 391.20 | 23.44% |
| 31.05.2018 | 21 266.10 | 21 088.00 | 178.10 | 0.84% | 18 627.20 | 2 638.90 | 14.17% |
| 30.04.2018 | 21 088.00 | 20 879.10 | 208.90 | 1.00% | 18 672.30 | 2 415.70 | 12.94% |
| 31.03.2018 | 20 879.10 | 20 502.30 | 376.80 | 1.84% | 18 470.90 | 2 408.20 | 13.04% |
| 28.02.2018 | 20 502.30 | 20 075.70 | 426.60 | 2.12% | 18 399.70 | 2 102.60 | 11.43% |
| 31.01.2018 | 20 075.70 | 19 737.10 | 338.60 | 1.72% | 17 963.80 | 2 111.90 | 11.76% |
| 31.12.2017 | 19 737.10 | 19 724.80 | 12.30 | 0.06% | 17 764.80 | 1 972.30 | 11.10% |
| 30.11.2017 | 19 724.80 | 18 890.30 | 834.50 | 4.42% | 17 083.50 | 2 641.30 | 15.46% |
| 31.10.2017 | 18 890.30 | 18 782.30 | 108.00 | 0.57% | 16 488.60 | 2 401.70 | 14.57% |
| 30.09.2017 | 18 782.30 | 19 084.50 | - 302.20 | -1.58% | 16 455.30 | 2 327.00 | 14.14% |
| 31.08.2017 | 19 084.50 | 19 010.50 | 74.00 | 0.39% | 16 314.80 | 2 769.70 | 16.98% |
| 31.07.2017 | 19 010.50 | 18 737.40 | 273.10 | 1.46% | 16 220.60 | 2 789.90 | 17.20% |
| 30.06.2017 | 18 737.40 | 18 627.20 | 110.20 | 0.59% | 16 183.70 | 2 553.70 | 15.78% |
| 31.05.2017 | 18 627.20 | 18 672.30 | -45.10 | -0.24% | 15 522.00 | 3 105.20 | 20.01% |
| 30.04.2017 | 18 672.30 | 18 470.90 | 201.40 | 1.09% | 15 814.20 | 2 858.10 | 18.07% |
| 31.03.2017 | 18 470.90 | 18 399.70 | 71.20 | 0.39% | 16 155.70 | 2 315.20 | 14.33% |
| 28.02.2017 | 18 399.70 | 17 963.80 | 435.90 | 2.43% | 15 955.10 | 2 444.60 | 15.32% |
| 31.01.2017 | 17 963.80 | 17 764.80 | 199.00 | 1.12% | 15 981.80 | 1 982.00 | 12.40% |
| 31.12.2016 | 17 764.80 | 17 083.50 | 681.30 | 3.99% | 16 180.60 | 1 584.20 | 9.79% |
| 30.11.2016 | 17 083.50 | 16 488.60 | 594.90 | 3.61% | 14 838.10 | 2 245.40 | 15.13% |
| 31.10.2016 | 16 488.60 | 16 455.30 | 33.30 | 0.20% | 14 937.00 | 1 551.60 | 10.39% |
| 30.09.2016 | 16 455.30 | 16 314.80 | 140.50 | 0.86% | 15 645.20 | 810.10 | 5.18% |
| 31.08.2016 | 16 314.80 | 16 220.60 | 94.20 | 0.58% | 15 556.10 | 758.70 | 4.88% |
| 31.07.2016 | 16 220.60 | 16 183.70 | 36.90 | 0.23% | 15 740.60 | 480.00 | 3.05% |
| 30.06.2016 | 16 183.70 | 15 522.00 | 661.70 | 4.26% | 16 109.50 | 74.20 | 0.46% |
| 31.05.2016 | 15 522.00 | 15 814.20 | - 292.20 | -1.85% | 16 154.90 | - 632.90 | -3.92% |
| 30.04.2016 | 15 814.20 | 16 155.70 | - 341.50 | -2.11% | 15 893.40 | -79.20 | -0.50% |
| 31.03.2016 | 16 155.70 | 15 955.10 | 200.60 | 1.26% | 15 687.30 | 468.40 | 2.99% |
| 29.02.2016 | 15 955.10 | 15 981.80 | -26.70 | -0.17% | 15 329.60 | 625.50 | 4.08% |
| 31.01.2016 | 15 981.80 | 16 180.60 | - 198.80 | -1.23% | 15 525.60 | 456.20 | 2.94% |
| 31.12.2015 | 16 180.60 | 14 838.10 | 1 342.50 | 9.05% | 15 395.60 | 785.00 | 5.10% |
| 30.11.2015 | 14 838.10 | 14 937.00 | -98.90 | -0.66% | 14 925.40 | -87.30 | -0.58% |
| 31.10.2015 | 14 937.00 | 15 645.20 | - 708.20 | -4.53% | 15 203.40 | - 266.40 | -1.75% |
| 30.09.2015 | 15 645.20 | 15 556.10 | 89.10 | 0.57% | 15 619.20 | 26.00 | 0.17% |
| 31.08.2015 | 15 556.10 | 15 740.60 | - 184.50 | -1.17% | 15 297.80 | 258.30 | 1.69% |
| 31.07.2015 | 15 740.60 | 16 109.50 | - 368.90 | -2.29% | 15 522.90 | 217.70 | 1.40% |
| 30.06.2015 | 16 109.50 | 16 154.90 | -45.40 | -0.28% | 15 918.80 | 190.70 | 1.20% |
| 31.05.2015 | 16 154.90 | 15 893.40 | 261.50 | 1.65% | 15 539.60 | 615.30 | 3.96% |
| 30.04.2015 | 15 893.40 | 15 687.30 | 206.10 | 1.31% | 15 485.70 | 407.70 | 2.63% |
| 31.03.2015 | 15 687.30 | 15 329.60 | 357.70 | 2.33% | 15 780.90 | -93.60 | -0.59% |
| 28.02.2015 | 15 329.60 | 15 525.60 | - 196.00 | -1.26% | 16 253.40 | - 923.80 | -5.68% |
| 31.01.2015 | 15 525.60 | 15 395.60 | 130.00 | 0.84% | 16 431.60 | - 906.00 | -5.51% |
| 31.12.2014 | 15 395.60 | 14 925.40 | 470.20 | 3.15% | 16 778.70 | -1 383.10 | -8.24% |
| 30.11.2014 | 14 925.40 | 15 203.40 | - 278.00 | -1.83% | 16 684.50 | -1 759.10 | -10.54% |
| 31.10.2014 | 15 203.40 | 15 619.20 | - 415.80 | -2.66% | 16 672.30 | -1 468.90 | -8.81% |
| 30.09.2014 | 15 619.20 | 15 297.80 | 321.40 | 2.10% | 16 492.70 | - 873.50 | -5.30% |
| 31.08.2014 | 15 297.80 | 15 522.90 | - 225.10 | -1.45% | 16 764.40 | -1 466.60 | -8.75% |
| 31.07.2014 | 15 522.90 | 15 918.80 | - 395.90 | -2.49% | 16 823.50 | -1 300.60 | -7.73% |
| 30.06.2014 | 15 918.80 | 15 539.60 | 379.20 | 2.44% | 17 562.20 | -1 643.40 | -9.36% |
| 31.05.2014 | 15 539.60 | 15 485.70 | 53.90 | 0.35% | 17 525.50 | -1 985.90 | -11.33% |
| 30.04.2014 | 15 485.70 | 15 780.90 | - 295.20 | -1.87% | 17 471.60 | -1 985.90 | -11.37% |
| 31.03.2014 | 15 780.90 | 16 253.40 | - 472.50 | -2.91% | 17 284.70 | -1 503.80 | -8.70% |
| 28.02.2014 | 16 253.40 | 16 431.60 | - 178.20 | -1.08% | 17 184.60 | - 931.20 | -5.42% |
| 31.01.2014 | 16 431.60 | 16 778.70 | - 347.10 | -2.07% | 17 025.20 | - 593.60 | -3.49% |
| 31.12.2013 | 16 778.70 | 16 684.50 | 94.20 | 0.56% | 15 454.40 | 1 324.30 | 8.57% |
| 30.11.2013 | 16 684.50 | 16 672.30 | 12.20 | 0.07% | 15 959.20 | 725.30 | 4.54% |
| 31.10.2013 | 16 672.30 | 16 492.70 | 179.60 | 1.09% | 15 765.00 | 907.30 | 5.76% |
| 30.09.2013 | 16 492.70 | 16 764.40 | - 271.70 | -1.62% | 16 109.90 | 382.80 | 2.38% |
| 31.08.2013 | 16 764.40 | 16 823.50 | -59.10 | -0.35% | 16 024.40 | 740.00 | 4.62% |
| 31.07.2013 | 16 823.50 | 17 562.20 | - 738.70 | -4.21% | 16 163.30 | 660.20 | 4.08% |
| 30.06.2013 | 17 562.20 | 17 525.50 | 36.70 | 0.21% | 16 577.30 | 984.90 | 5.94% |
| 31.05.2013 | 17 525.50 | 17 471.60 | 53.90 | 0.31% | 16 518.30 | 1 007.20 | 6.10% |
| 30.04.2013 | 17 471.60 | 17 284.70 | 186.90 | 1.08% | 16 436.70 | 1 034.90 | 6.30% |
| 31.03.2013 | 17 284.70 | 17 184.60 | 100.10 | 0.58% | 16 511.40 | 773.30 | 4.68% |
| 28.02.2013 | 17 184.60 | 17 025.20 | 159.40 | 0.94% | 16 075.70 | 1 108.90 | 6.90% |
| 31.01.2013 | 17 025.20 | 15 454.40 | 1 570.80 | 10.16% | 16 540.20 | 485.00 | 2.93% |
| 31.12.2012 | 15 454.40 | 15 959.20 | - 504.80 | -3.16% | 16 568.00 | -1 113.60 | -6.72% |
| 30.11.2012 | 15 959.20 | 15 765.00 | 194.20 | 1.23% | 16 913.30 | - 954.10 | -5.64% |
| 31.10.2012 | 15 765.00 | 16 109.90 | - 344.90 | -2.14% | 16 906.60 | -1 141.60 | -6.75% |
| 30.09.2012 | 16 109.90 | 16 024.40 | 85.50 | 0.53% | 16 146.80 | -36.90 | -0.23% |
| 31.08.2012 | 16 024.40 | 16 163.30 | - 138.90 | -0.86% | 16 419.10 | - 394.70 | -2.40% |
| 31.07.2012 | 16 163.30 | 16 577.30 | - 414.00 | -2.50% | 16 500.70 | - 337.40 | -2.04% |
| 30.06.2012 | 16 577.30 | 16 518.30 | 59.00 | 0.36% | 16 837.90 | - 260.60 | -1.55% |
| 31.05.2012 | 16 518.30 | 16 436.70 | 81.60 | 0.50% | 16 372.40 | 145.90 | 0.89% |
| 30.04.2012 | 16 436.70 | 16 511.40 | -74.70 | -0.45% | 15 905.60 | 531.10 | 3.34% |
| 31.03.2012 | 16 511.40 | 16 075.70 | 435.70 | 2.71% | 15 319.70 | 1 191.70 | 7.78% |
| 29.02.2012 | 16 075.70 | 16 540.20 | - 464.50 | -2.81% | 15 166.20 | 909.50 | 6.00% |
| 31.01.2012 | 16 540.20 | 16 568.00 | -27.80 | -0.17% | 15 033.90 | 1 506.30 | 10.02% |
| 31.12.2011 | 16 568.00 | 16 913.30 | - 345.30 | -2.04% | 14 926.50 | 1 641.50 | 11.00% |
| 30.11.2011 | 16 913.30 | 16 906.60 | 6.70 | 0.04% | 15 057.60 | 1 855.70 | 12.32% |
| 31.10.2011 | 16 906.60 | 16 146.80 | 759.80 | 4.71% | 15 061.70 | 1 844.90 | 12.25% |
| 30.09.2011 | 16 146.80 | 16 419.10 | - 272.30 | -1.66% | 15 542.40 | 604.40 | 3.89% |
| 31.08.2011 | 16 419.10 | 16 500.70 | -81.60 | -0.49% | 15 788.40 | 630.70 | 3.99% |
| 31.07.2011 | 16 500.70 | 16 837.90 | - 337.20 | -2.00% | 15 930.90 | 569.80 | 3.58% |
| 30.06.2011 | 16 837.90 | 16 372.40 | 465.50 | 2.84% | 16 225.30 | 612.60 | 3.78% |
| 31.05.2011 | 16 372.40 | 15 905.60 | 466.80 | 2.93% | 16 130.50 | 241.90 | 1.50% |
| 30.04.2011 | 15 905.60 | 15 319.70 | 585.90 | 3.82% | 16 183.30 | - 277.70 | -1.72% |
| 31.03.2011 | 15 319.70 | 15 166.20 | 153.50 | 1.01% | 16 126.50 | - 806.80 | -5.00% |
| 28.02.2011 | 15 166.20 | 15 033.90 | 132.30 | 0.88% | 16 192.90 | -1 026.70 | -6.34% |
| 31.01.2011 | 15 033.90 | 14 926.50 | 107.40 | 0.72% | 15 985.60 | - 951.70 | -5.95% |
| 31.12.2010 | 14 926.50 | 15 057.60 | - 131.10 | -0.87% | 15 747.20 | - 820.70 | -5.21% |
| 30.11.2010 | 15 057.60 | 15 061.70 | -4.10 | -0.03% | 16 326.90 | -1 269.30 | -7.77% |
| 31.10.2010 | 15 061.70 | 15 542.40 | - 480.70 | -3.09% | 16 623.50 | -1 561.80 | -9.40% |
| 30.09.2010 | 15 542.40 | 15 788.40 | - 246.00 | -1.56% | 16 701.00 | -1 158.60 | -6.94% |
| 31.08.2010 | 15 788.40 | 15 930.90 | - 142.50 | -0.89% | 17 009.60 | -1 221.20 | -7.18% |
| 31.07.2010 | 15 930.90 | 16 225.30 | - 294.40 | -1.81% | 17 414.80 | -1 483.90 | -8.52% |
| 30.06.2010 | 16 225.30 | 16 130.50 | 94.80 | 0.59% | 17 920.40 | -1 695.10 | -9.46% |
| 31.05.2010 | 16 130.50 | 16 183.30 | -52.80 | -0.33% | 18 243.70 | -2 113.20 | -11.58% |
| 30.04.2010 | 16 183.30 | 16 126.50 | 56.80 | 0.35% | 18 609.10 | -2 425.80 | -13.04% |
| 31.03.2010 | 16 126.50 | 16 192.90 | -66.40 | -0.41% | 18 735.60 | -2 609.10 | -13.93% |
| 28.02.2010 | 16 192.90 | 15 985.60 | 207.30 | 1.30% | 19 209.40 | -3 016.50 | -15.70% |
| 31.01.2010 | 15 985.60 | 15 747.20 | 238.40 | 1.51% | 19 261.50 | -3 275.90 | -17.01% |
| 31.12.2009 | 15 747.20 | 16 326.90 | - 579.70 | -3.55% | - | - | - |
| 30.11.2009 | 16 326.90 | 16 623.50 | - 296.60 | -1.78% | - | - | - |
| 31.10.2009 | 16 623.50 | 16 701.00 | -77.50 | -0.46% | - | - | - |
| 30.09.2009 | 16 701.00 | 17 009.60 | - 308.60 | -1.81% | - | - | - |
| 31.08.2009 | 17 009.60 | 17 414.80 | - 405.20 | -2.33% | - | - | - |
| 31.07.2009 | 17 414.80 | 17 920.40 | - 505.60 | -2.82% | - | - | - |
| 30.06.2009 | 17 920.40 | 18 243.70 | - 323.30 | -1.77% | - | - | - |
| 31.05.2009 | 18 243.70 | 18 609.10 | - 365.40 | -1.96% | - | - | - |
| 30.04.2009 | 18 609.10 | 18 735.60 | - 126.50 | -0.68% | - | - | - |
| 31.03.2009 | 18 735.60 | 19 209.40 | - 473.80 | -2.47% | - | - | - |
| 28.02.2009 | 19 209.40 | 19 261.50 | -52.10 | -0.27% | - | - | - |
| 31.01.2009 | 19 261.50 | - | - | - | - | - | - |
Graf jako obrázek

Podobné sestavy
Aplikace Ekonomika ČNB ze sekce makroekonomika zobrazuje časové řady hlavních makroekonomických údajů z ekonomiky ČR. Najdete zde přes 10.000 grafů různých hodnot od úrokových sazeb, přes statistiky státního rozpočtu, statistiky ČNB a data zpracovávaná ČSÚ. Data jsou k dispozici obvykle za posledních více než 20 let, od prosince roku 1992. Zdroj dat: ČNB ARAD

