Central government (Deposits by non-monetary financial corporations and by government - flows) - ekonomika ČNB
Aktualizace dat Central government (Deposits by non-monetary financial corporations and by government - flows) v této aplikaci skončila 30.6.2023. Aktualizovná data časových řad najdete na stránkách nové aplikace z dat ARAD ČNB
Nové časové řady makroekonomiky a jejich data
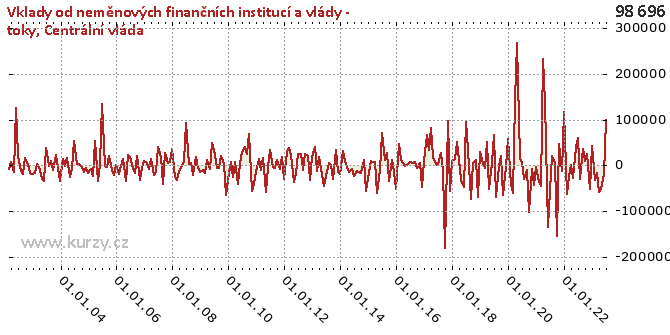
Graf hodnot, Deposits by non-monetary financial corporations and by government - flows
Meziroční srovnání
Minima a maxima
| Typ | Období | Hodnota |
|---|---|---|
| Max | 30.04.2020 | 267 915.30 |
| Min | 30.09.2017 | - 181 117.30 |
Historické hodnoty
| Období | Hodnota | Předchozí | Rozdíl | Změna | Před rokem | Rozdíl | Změna |
|---|---|---|---|---|---|---|---|
| 31.07.2020 | -30 591.40 | 4 485.60 | -35 077.00 | - 781.99% | -67 970.10 | 37 378.70 | -54.99% |
| 30.06.2020 | 4 485.60 | 17 043.40 | -12 557.80 | -73.68% | 66 290.80 | -61 805.20 | -93.23% |
| 31.05.2020 | 17 043.40 | 267 915.30 | - 250 871.90 | -93.64% | 5 969.40 | 11 074.00 | 185.51% |
| 30.04.2020 | 267 915.30 | 143 043.20 | 124 872.10 | 87.30% | -51 600.10 | 319 515.40 | - 619.21% |
| 31.03.2020 | 143 043.20 | -60 889.50 | 203 932.70 | - 334.92% | 51 942.80 | 91 100.40 | 175.39% |
| 29.02.2020 | -60 889.50 | -43 736.80 | -17 152.70 | 39.22% | -5 962.00 | -54 927.50 | 921.29% |
| 31.01.2020 | -43 736.80 | 57 849.40 | - 101 586.20 | - 175.60% | 5 351.20 | -49 088.00 | - 917.33% |
| 31.12.2019 | 57 849.40 | -3 652.80 | 61 502.20 | -1 683.70% | 30 194.70 | 27 654.70 | 91.59% |
| 30.11.2019 | -3 652.80 | -63 606.20 | 59 953.40 | -94.26% | -69 174.20 | 65 521.40 | -94.72% |
| 31.10.2019 | -63 606.20 | 20 174.90 | -83 781.10 | - 415.27% | 11 278.20 | -74 884.40 | - 663.97% |
| 30.09.2019 | 20 174.90 | -2 133.20 | 22 308.10 | -1 045.76% | 5 150.30 | 15 024.60 | 291.72% |
| 31.08.2019 | -2 133.20 | -67 970.10 | 65 836.90 | -96.86% | -73 444.70 | 71 311.50 | -97.10% |
| 31.07.2019 | -67 970.10 | 66 290.80 | - 134 260.90 | - 202.53% | 32 693.10 | - 100 663.20 | - 307.90% |
| 30.06.2019 | 66 290.80 | 5 969.40 | 60 321.40 | 1 010.51% | 95 890.60 | -29 599.80 | -30.87% |
| 31.05.2019 | 5 969.40 | -51 600.10 | 57 569.50 | - 111.57% | -46 660.10 | 52 629.50 | - 112.79% |
| 30.04.2019 | -51 600.10 | 51 942.80 | - 103 542.90 | - 199.34% | -31 250.60 | -20 349.50 | 65.12% |
| 31.03.2019 | 51 942.80 | -5 962.00 | 57 904.80 | - 971.23% | 11 847.00 | 40 095.80 | 338.45% |
| 28.02.2019 | -5 962.00 | 5 351.20 | -11 313.20 | - 211.41% | 51 276.60 | -57 238.60 | - 111.63% |
| 31.01.2019 | 5 351.20 | 30 194.70 | -24 843.50 | -82.28% | 13 613.50 | -8 262.30 | -60.69% |
| 31.12.2018 | 30 194.70 | -69 174.20 | 99 368.90 | - 143.65% | 9 877.80 | 20 316.90 | 205.68% |
| 30.11.2018 | -69 174.20 | 11 278.20 | -80 452.40 | - 713.34% | -55 222.90 | -13 951.30 | 25.26% |
| 31.10.2018 | 11 278.20 | 5 150.30 | 6 127.90 | 118.98% | 95 803.10 | -84 524.90 | -88.23% |
| 30.09.2018 | 5 150.30 | -73 444.70 | 78 595.00 | - 107.01% | - 181 117.30 | 186 267.60 | - 102.84% |
| 31.08.2018 | -73 444.70 | 32 693.10 | - 106 137.80 | - 324.65% | -11 634.90 | -61 809.80 | 531.24% |
| 31.07.2018 | 32 693.10 | 95 890.60 | -63 197.50 | -65.91% | 27 693.60 | 4 999.50 | 18.05% |
| 30.06.2018 | 95 890.60 | -46 660.10 | 142 550.70 | - 305.51% | 1 010.20 | 94 880.40 | 9 392.24% |
| 31.05.2018 | -46 660.10 | -31 250.60 | -15 409.50 | 49.31% | 2 285.90 | -48 946.00 | -2 141.21% |
| 30.04.2018 | -31 250.60 | 11 847.00 | -43 097.60 | - 363.78% | 19 387.10 | -50 637.70 | - 261.19% |
| 31.03.2018 | 11 847.00 | 51 276.60 | -39 429.60 | -76.90% | 81 919.90 | -70 072.90 | -85.54% |
| 28.02.2018 | 51 276.60 | 13 613.50 | 37 663.10 | 276.66% | 33 253.90 | 18 022.70 | 54.20% |
| 31.01.2018 | 13 613.50 | 9 877.80 | 3 735.70 | 37.82% | 66 173.50 | -52 560.00 | -79.43% |
| 31.12.2017 | 9 877.80 | -55 222.90 | 65 100.70 | - 117.89% | 10 650.50 | - 772.70 | -7.25% |
| 30.11.2017 | -55 222.90 | 95 803.10 | - 151 026.00 | - 157.64% | -47 365.00 | -7 857.90 | 16.59% |
| 31.10.2017 | 95 803.10 | - 181 117.30 | 276 920.40 | - 152.90% | 6 023.70 | 89 779.40 | 1 490.44% |
| 30.09.2017 | - 181 117.30 | -11 634.90 | - 169 482.40 | 1 456.67% | -5 214.20 | - 175 903.10 | 3 373.54% |
| 31.08.2017 | -11 634.90 | 27 693.60 | -39 328.50 | - 142.01% | 7 750.60 | -19 385.50 | - 250.12% |
| 31.07.2017 | 27 693.60 | 1 010.20 | 26 683.40 | 2 641.40% | 4 934.20 | 22 759.40 | 461.26% |
| 30.06.2017 | 1 010.20 | 2 285.90 | -1 275.70 | -55.81% | 8 310.70 | -7 300.50 | -87.84% |
| 31.05.2017 | 2 285.90 | 19 387.10 | -17 101.20 | -88.21% | 2 613.30 | - 327.40 | -12.53% |
| 30.04.2017 | 19 387.10 | 81 919.90 | -62 532.80 | -76.33% | -1 403.40 | 20 790.50 | -1 481.44% |
| 31.03.2017 | 81 919.90 | 33 253.90 | 48 666.00 | 146.35% | 5 705.60 | 76 214.30 | 1 335.78% |
| 28.02.2017 | 33 253.90 | 66 173.50 | -32 919.60 | -49.75% | 12 092.90 | 21 161.00 | 174.99% |
| 31.01.2017 | 66 173.50 | 10 650.50 | 55 523.00 | 521.32% | 46 784.60 | 19 388.90 | 41.44% |
| 31.12.2016 | 10 650.50 | -47 365.00 | 58 015.50 | - 122.49% | -52 248.00 | 62 898.50 | - 120.38% |
| 30.11.2016 | -47 365.00 | 6 023.70 | -53 388.70 | - 886.31% | -14 846.10 | -32 518.90 | 219.04% |
| 31.10.2016 | 6 023.70 | -5 214.20 | 11 237.90 | - 215.52% | 12 628.40 | -6 604.70 | -52.30% |
| 30.09.2016 | -5 214.20 | 7 750.60 | -12 964.80 | - 167.27% | -33 994.90 | 28 780.70 | -84.66% |
| 31.08.2016 | 7 750.60 | 4 934.20 | 2 816.40 | 57.08% | 27 308.00 | -19 557.40 | -71.62% |
| 31.07.2016 | 4 934.20 | 8 310.70 | -3 376.50 | -40.63% | 12 126.60 | -7 192.40 | -59.31% |
| 30.06.2016 | 8 310.70 | 2 613.30 | 5 697.40 | 218.02% | 70 339.50 | -62 028.80 | -88.18% |
| 31.05.2016 | 2 613.30 | -1 403.40 | 4 016.70 | - 286.21% | -10 180.90 | 12 794.20 | - 125.67% |
| 30.04.2016 | -1 403.40 | 5 705.60 | -7 109.00 | - 124.60% | -60 898.30 | 59 494.90 | -97.70% |
| 31.03.2016 | 5 705.60 | 12 092.90 | -6 387.30 | -52.82% | 6 982.30 | -1 276.70 | -18.28% |
| 29.02.2016 | 12 092.90 | 46 784.60 | -34 691.70 | -74.15% | 7 338.80 | 4 754.10 | 64.78% |
| 31.01.2016 | 46 784.60 | -52 248.00 | 99 032.60 | - 189.54% | 9 932.50 | 36 852.10 | 371.03% |
| 31.12.2015 | -52 248.00 | -14 846.10 | -37 401.90 | 251.93% | -28 320.80 | -23 927.20 | 84.49% |
| 30.11.2015 | -14 846.10 | 12 628.40 | -27 474.50 | - 217.56% | -56 209.70 | 41 363.60 | -73.59% |
| 31.10.2015 | 12 628.40 | -33 994.90 | 46 623.30 | - 137.15% | 10 809.80 | 1 818.60 | 16.82% |
| 30.09.2015 | -33 994.90 | 27 308.00 | -61 302.90 | - 224.49% | -16 108.80 | -17 886.10 | 111.03% |
| 31.08.2015 | 27 308.00 | 12 126.60 | 15 181.40 | 125.19% | -13 355.20 | 40 663.20 | - 304.47% |
| 31.07.2015 | 12 126.60 | 70 339.50 | -58 212.90 | -82.76% | -11 570.10 | 23 696.70 | - 204.81% |
| 30.06.2015 | 70 339.50 | -10 180.90 | 80 520.40 | - 790.90% | -22 217.80 | 92 557.30 | - 416.59% |
| 31.05.2015 | -10 180.90 | -60 898.30 | 50 717.40 | -83.28% | -8 925.00 | -1 255.90 | 14.07% |
| 30.04.2015 | -60 898.30 | 6 982.30 | -67 880.60 | - 972.18% | -14 981.10 | -45 917.20 | 306.50% |
| 31.03.2015 | 6 982.30 | 7 338.80 | - 356.50 | -4.86% | -4 428.10 | 11 410.40 | - 257.68% |
| 28.02.2015 | 7 338.80 | 9 932.50 | -2 593.70 | -26.11% | 9 013.50 | -1 674.70 | -18.58% |
| 31.01.2015 | 9 932.50 | -28 320.80 | 38 253.30 | - 135.07% | 31 571.50 | -21 639.00 | -68.54% |
| 31.12.2014 | -28 320.80 | -56 209.70 | 27 888.90 | -49.62% | -18 346.90 | -9 973.90 | 54.36% |
| 30.11.2014 | -56 209.70 | 10 809.80 | -67 019.50 | - 619.99% | -15 230.80 | -40 978.90 | 269.05% |
| 31.10.2014 | 10 809.80 | -16 108.80 | 26 918.60 | - 167.10% | 34 176.10 | -23 366.30 | -68.37% |
| 30.09.2014 | -16 108.80 | -13 355.20 | -2 753.60 | 20.62% | -30 316.30 | 14 207.50 | -46.86% |
| 31.08.2014 | -13 355.20 | -11 570.10 | -1 785.10 | 15.43% | 1 908.20 | -15 263.40 | - 799.88% |
| 31.07.2014 | -11 570.10 | -22 217.80 | 10 647.70 | -47.92% | 5 265.80 | -16 835.90 | - 319.72% |
| 30.06.2014 | -22 217.80 | -8 925.00 | -13 292.80 | 148.94% | -24 221.10 | 2 003.30 | -8.27% |
| 31.05.2014 | -8 925.00 | -14 981.10 | 6 056.10 | -40.42% | -45 638.40 | 36 713.40 | -80.44% |
| 30.04.2014 | -14 981.10 | -4 428.10 | -10 553.00 | 238.32% | -20 293.30 | 5 312.20 | -26.18% |
| 31.03.2014 | -4 428.10 | 9 013.50 | -13 441.60 | - 149.13% | 18 227.20 | -22 655.30 | - 124.29% |
| 28.02.2014 | 9 013.50 | 31 571.50 | -22 558.00 | -71.45% | -11 255.90 | 20 269.40 | - 180.08% |
| 31.01.2014 | 31 571.50 | -18 346.90 | 49 918.40 | - 272.08% | 40 949.50 | -9 378.00 | -22.90% |
| 31.12.2013 | -18 346.90 | -15 230.80 | -3 116.10 | 20.46% | 18 396.20 | -36 743.10 | - 199.73% |
| 30.11.2013 | -15 230.80 | 34 176.10 | -49 406.90 | - 144.57% | -31 239.50 | 16 008.70 | -51.24% |
| 31.10.2013 | 34 176.10 | -30 316.30 | 64 492.40 | - 212.73% | 21 212.00 | 12 964.10 | 61.12% |
| 30.09.2013 | -30 316.30 | 1 908.20 | -32 224.50 | -1 688.74% | 25 182.00 | -55 498.30 | - 220.39% |
| 31.08.2013 | 1 908.20 | 5 265.80 | -3 357.60 | -63.76% | -10 264.60 | 12 172.80 | - 118.59% |
| 31.07.2013 | 5 265.80 | -24 221.10 | 29 486.90 | - 121.74% | 25 154.20 | -19 888.40 | -79.07% |
| 30.06.2013 | -24 221.10 | -45 638.40 | 21 417.30 | -46.93% | 25 633.70 | -49 854.80 | - 194.49% |
| 31.05.2013 | -45 638.40 | -20 293.30 | -25 345.10 | 124.89% | -15 789.90 | -29 848.50 | 189.04% |
| 30.04.2013 | -20 293.30 | 18 227.20 | -38 520.50 | - 211.34% | -35 628.90 | 15 335.60 | -43.04% |
| 31.03.2013 | 18 227.20 | -11 255.90 | 29 483.10 | - 261.93% | 21 615.90 | -3 388.70 | -15.68% |
| 28.02.2013 | -11 255.90 | 40 949.50 | -52 205.40 | - 127.49% | 37 119.90 | -48 375.80 | - 130.32% |
| 31.01.2013 | 40 949.50 | 18 396.20 | 22 553.30 | 122.60% | 29 571.00 | 11 378.50 | 38.48% |
| 31.12.2012 | 18 396.20 | -31 239.50 | 49 635.70 | - 158.89% | -28 903.30 | 47 299.50 | - 163.65% |
| 30.11.2012 | -31 239.50 | 21 212.00 | -52 451.50 | - 247.27% | 18 724.10 | -49 963.60 | - 266.84% |
| 31.10.2012 | 21 212.00 | 25 182.00 | -3 970.00 | -15.77% | -7 785.90 | 28 997.90 | - 372.44% |
| 30.09.2012 | 25 182.00 | -10 264.60 | 35 446.60 | - 345.33% | 11 655.90 | 13 526.10 | 116.05% |
| 31.08.2012 | -10 264.60 | 25 154.20 | -35 418.80 | - 140.81% | -4 626.80 | -5 637.80 | 121.85% |
| 31.07.2012 | 25 154.20 | 25 633.70 | - 479.50 | -1.87% | -2 542.30 | 27 696.50 | -1 089.43% |
| 30.06.2012 | 25 633.70 | -15 789.90 | 41 423.60 | - 262.34% | 32 789.10 | -7 155.40 | -21.82% |
| 31.05.2012 | -15 789.90 | -35 628.90 | 19 839.00 | -55.68% | -3 813.30 | -11 976.60 | 314.07% |
| 30.04.2012 | -35 628.90 | 21 615.90 | -57 244.80 | - 264.83% | -57 095.60 | 21 466.70 | -37.60% |
| 31.03.2012 | 21 615.90 | 37 119.90 | -15 504.00 | -41.77% | 15 351.00 | 6 264.90 | 40.81% |
| 29.02.2012 | 37 119.90 | 29 571.00 | 7 548.90 | 25.53% | -9 082.10 | 46 202.00 | - 508.71% |
| 31.01.2012 | 29 571.00 | -28 903.30 | 58 474.30 | - 202.31% | 13 433.60 | 16 137.40 | 120.13% |
| 31.12.2011 | -28 903.30 | 18 724.10 | -47 627.40 | - 254.36% | -14 052.20 | -14 851.10 | 105.69% |
| 30.11.2011 | 18 724.10 | -7 785.90 | 26 510.00 | - 340.49% | -40 981.10 | 59 705.20 | - 145.69% |
| 31.10.2011 | -7 785.90 | 11 655.90 | -19 441.80 | - 166.80% | -55 115.40 | 47 329.50 | -85.87% |
| 30.09.2011 | 11 655.90 | -4 626.80 | 16 282.70 | - 351.92% | 67 708.30 | -56 052.40 | -82.79% |
| 31.08.2011 | -4 626.80 | -2 542.30 | -2 084.50 | 81.99% | 25 385.20 | -30 012.00 | - 118.23% |
| 31.07.2011 | -2 542.30 | 32 789.10 | -35 331.40 | - 107.75% | 40 548.30 | -43 090.60 | - 106.27% |
| 30.06.2011 | 32 789.10 | -3 813.30 | 36 602.40 | - 959.86% | 30 260.80 | 2 528.30 | 8.36% |
| 31.05.2011 | -3 813.30 | -57 095.60 | 53 282.30 | -93.32% | 2 145.10 | -5 958.40 | - 277.77% |
| 30.04.2011 | -57 095.60 | 15 351.00 | -72 446.60 | - 471.93% | -41 279.70 | -15 815.90 | 38.31% |
| 31.03.2011 | 15 351.00 | -9 082.10 | 24 433.10 | - 269.02% | 7 466.40 | 7 884.60 | 105.60% |
| 28.02.2011 | -9 082.10 | 13 433.60 | -22 515.70 | - 167.61% | -25 895.90 | 16 813.80 | -64.93% |
| 31.01.2011 | 13 433.60 | -14 052.20 | 27 485.80 | - 195.60% | 7 635.70 | 5 797.90 | 75.93% |
| 31.12.2010 | -14 052.20 | -40 981.10 | 26 928.90 | -65.71% | -32 347.20 | 18 295.00 | -56.56% |
| 30.11.2010 | -40 981.10 | -55 115.40 | 14 134.30 | -25.64% | -64 241.40 | 23 260.30 | -36.21% |
| 31.10.2010 | -55 115.40 | 67 708.30 | - 122 823.70 | - 181.40% | 2 456.30 | -57 571.70 | -2 343.84% |
| 30.09.2010 | 67 708.30 | 25 385.20 | 42 323.10 | 166.72% | 20 658.50 | 47 049.80 | 227.75% |
| 31.08.2010 | 25 385.20 | 40 548.30 | -15 163.10 | -37.40% | -6 058.40 | 31 443.60 | - 519.01% |
| 31.07.2010 | 40 548.30 | 30 260.80 | 10 287.50 | 34.00% | -5 405.90 | 45 954.20 | - 850.07% |
| 30.06.2010 | 30 260.80 | 2 145.10 | 28 115.70 | 1 310.69% | 32 656.30 | -2 395.50 | -7.34% |
| 31.05.2010 | 2 145.10 | -41 279.70 | 43 424.80 | - 105.20% | 48 437.00 | -46 291.90 | -95.57% |
| 30.04.2010 | -41 279.70 | 7 466.40 | -48 746.10 | - 652.87% | -8 915.20 | -32 364.50 | 363.03% |
| 31.03.2010 | 7 466.40 | -25 895.90 | 33 362.30 | - 128.83% | 11 073.10 | -3 606.70 | -32.57% |
| 28.02.2010 | -25 895.90 | 7 635.70 | -33 531.60 | - 439.14% | -17 447.50 | -8 448.40 | 48.42% |
| 31.01.2010 | 7 635.70 | -32 347.20 | 39 982.90 | - 123.61% | -9 779.90 | 17 415.60 | - 178.08% |
| 31.12.2009 | -32 347.20 | -64 241.40 | 31 894.20 | -49.65% | -13 553.90 | -18 793.30 | 138.66% |
| 30.11.2009 | -64 241.40 | 2 456.30 | -66 697.70 | -2 715.37% | -6 538.90 | -57 702.50 | 882.45% |
| 31.10.2009 | 2 456.30 | 20 658.50 | -18 202.20 | -88.11% | 18 489.30 | -16 033.00 | -86.72% |
| 30.09.2009 | 20 658.50 | -6 058.40 | 26 716.90 | - 440.99% | -19 882.80 | 40 541.30 | - 203.90% |
| 31.08.2009 | -6 058.40 | -5 405.90 | - 652.50 | 12.07% | 5 414.90 | -11 473.30 | - 211.88% |
| 31.07.2009 | -5 405.90 | 32 656.30 | -38 062.20 | - 116.55% | 2 892.60 | -8 298.50 | - 286.89% |
| 30.06.2009 | 32 656.30 | 48 437.00 | -15 780.70 | -32.58% | 93 214.90 | -60 558.60 | -64.97% |
| 31.05.2009 | 48 437.00 | -8 915.20 | 57 352.20 | - 643.31% | 9 360.50 | 39 076.50 | 417.46% |
| 30.04.2009 | -8 915.20 | 11 073.10 | -19 988.30 | - 180.51% | -1 865.90 | -7 049.30 | 377.80% |
| 31.03.2009 | 11 073.10 | -17 447.50 | 28 520.60 | - 163.47% | -12 689.60 | 23 762.70 | - 187.26% |
| 28.02.2009 | -17 447.50 | -9 779.90 | -7 667.60 | 78.40% | -31 590.20 | 14 142.70 | -44.77% |
| 31.01.2009 | -9 779.90 | -13 553.90 | 3 774.00 | -27.84% | -25 972.80 | 16 192.90 | -62.35% |
| 31.12.2008 | -13 553.90 | -6 538.90 | -7 015.00 | 107.28% | 35 603.40 | -49 157.30 | - 138.07% |
| 30.11.2008 | -6 538.90 | 18 489.30 | -25 028.20 | - 135.37% | 7 758.10 | -14 297.00 | - 184.28% |
| 31.10.2008 | 18 489.30 | -19 882.80 | 38 372.10 | - 192.99% | 4 890.40 | 13 598.90 | 278.07% |
| 30.09.2008 | -19 882.80 | 5 414.90 | -25 297.70 | - 467.19% | 27 752.40 | -47 635.20 | - 171.64% |
| 31.08.2008 | 5 414.90 | 2 892.60 | 2 522.30 | 87.20% | -40 453.40 | 45 868.30 | - 113.39% |
| 31.07.2008 | 2 892.60 | 93 214.90 | -90 322.30 | -96.90% | 19 043.90 | -16 151.30 | -84.81% |
| 30.06.2008 | 93 214.90 | 9 360.50 | 83 854.40 | 895.83% | 40 536.70 | 52 678.20 | 129.95% |
| 31.05.2008 | 9 360.50 | -1 865.90 | 11 226.40 | - 601.66% | -14 847.20 | 24 207.70 | - 163.05% |
| 30.04.2008 | -1 865.90 | -12 689.60 | 10 823.70 | -85.30% | -19 902.60 | 18 036.70 | -90.62% |
| 31.03.2008 | -12 689.60 | -31 590.20 | 18 900.60 | -59.83% | 14 027.40 | -26 717.00 | - 190.46% |
| 29.02.2008 | -31 590.20 | -25 972.80 | -5 617.40 | 21.63% | -8 697.30 | -22 892.90 | 263.22% |
| 31.01.2008 | -25 972.80 | 35 603.40 | -61 576.20 | - 172.95% | 4 834.20 | -30 807.00 | - 637.27% |
| 31.12.2007 | 35 603.40 | 7 758.10 | 27 845.30 | 358.92% | 10 378.80 | 25 224.60 | 243.04% |
| 30.11.2007 | 7 758.10 | 4 890.40 | 2 867.70 | 58.64% | -3 348.70 | 11 106.80 | - 331.67% |
| 31.10.2007 | 4 890.40 | 27 752.40 | -22 862.00 | -82.38% | -31 808.60 | 36 699.00 | - 115.37% |
| 30.09.2007 | 27 752.40 | -40 453.40 | 68 205.80 | - 168.60% | 20 313.80 | 7 438.60 | 36.62% |
| 31.08.2007 | -40 453.40 | 19 043.90 | -59 497.30 | - 312.42% | -17 510.00 | -22 943.40 | 131.03% |
| 31.07.2007 | 19 043.90 | 40 536.70 | -21 492.80 | -53.02% | -6 374.30 | 25 418.20 | - 398.76% |
| 30.06.2007 | 40 536.70 | -14 847.20 | 55 383.90 | - 373.03% | 17 278.90 | 23 257.80 | 134.60% |
| 31.05.2007 | -14 847.20 | -19 902.60 | 5 055.40 | -25.40% | 21 906.80 | -36 754.00 | - 167.77% |
| 30.04.2007 | -19 902.60 | 14 027.40 | -33 930.00 | - 241.88% | -33 449.00 | 13 546.40 | -40.50% |
| 31.03.2007 | 14 027.40 | -8 697.30 | 22 724.70 | - 261.28% | 14 646.70 | - 619.30 | -4.23% |
| 28.02.2007 | -8 697.30 | 4 834.20 | -13 531.50 | - 279.91% | -1 771.90 | -6 925.40 | 390.85% |
| 31.01.2007 | 4 834.20 | 10 378.80 | -5 544.60 | -53.42% | -19 515.40 | 24 349.60 | - 124.77% |
| 31.12.2006 | 10 378.80 | -3 348.70 | 13 727.50 | - 409.94% | -11.60 | 10 390.40 | -89 572.41% |
| 30.11.2006 | -3 348.70 | -31 808.60 | 28 459.90 | -89.47% | -20 971.70 | 17 623.00 | -84.03% |
| 31.10.2006 | -31 808.60 | 20 313.80 | -52 122.40 | - 256.59% | -9 735.10 | -22 073.50 | 226.74% |
| 30.09.2006 | 20 313.80 | -17 510.00 | 37 823.80 | - 216.01% | 20 183.50 | 130.30 | 0.65% |
| 31.08.2006 | -17 510.00 | -6 374.30 | -11 135.70 | 174.70% | -2 960.30 | -14 549.70 | 491.49% |
| 31.07.2006 | -6 374.30 | 17 278.90 | -23 653.20 | - 136.89% | -1 332.10 | -5 042.20 | 378.52% |
| 30.06.2006 | 17 278.90 | 21 906.80 | -4 627.90 | -21.13% | 133 242.40 | - 115 963.50 | -87.03% |
| 31.05.2006 | 21 906.80 | -33 449.00 | 55 355.80 | - 165.49% | 2 629.50 | 19 277.30 | 733.12% |
| 30.04.2006 | -33 449.00 | 14 646.70 | -48 095.70 | - 328.37% | -34 600.90 | 1 151.90 | -3.33% |
| 31.03.2006 | 14 646.70 | -1 771.90 | 16 418.60 | - 926.61% | 52 356.30 | -37 709.60 | -72.02% |
| 28.02.2006 | -1 771.90 | -19 515.40 | 17 743.50 | -90.92% | -22 256.80 | 20 484.90 | -92.04% |
| 31.01.2006 | -19 515.40 | -11.60 | -19 503.80 | 168 136.21% | -8 643.10 | -10 872.30 | 125.79% |
| 31.12.2005 | -11.60 | -20 971.70 | 20 960.10 | -99.94% | -16 949.20 | 16 937.60 | -99.93% |
| 30.11.2005 | -20 971.70 | -9 735.10 | -11 236.60 | 115.42% | -5 797.60 | -15 174.10 | 261.73% |
| 31.10.2005 | -9 735.10 | 20 183.50 | -29 918.60 | - 148.23% | -15 224.90 | 5 489.80 | -36.06% |
| 30.09.2005 | 20 183.50 | -2 960.30 | 23 143.80 | - 781.81% | -2 021.70 | 22 205.20 | -1 098.34% |
| 31.08.2005 | -2 960.30 | -1 332.10 | -1 628.20 | 122.23% | 2 488.40 | -5 448.70 | - 218.96% |
| 31.07.2005 | -1 332.10 | 133 242.40 | - 134 574.50 | - 101.00% | 3 703.00 | -5 035.10 | - 135.97% |
| 30.06.2005 | 133 242.40 | 2 629.50 | 130 612.90 | 4 967.21% | 52 843.60 | 80 398.80 | 152.14% |
| 31.05.2005 | 2 629.50 | -34 600.90 | 37 230.40 | - 107.60% | -6 099.00 | 8 728.50 | - 143.11% |
| 30.04.2005 | -34 600.90 | 52 356.30 | -86 957.20 | - 166.09% | -25 695.30 | -8 905.60 | 34.66% |
| 31.03.2005 | 52 356.30 | -22 256.80 | 74 613.10 | - 335.24% | 16 992.10 | 35 364.20 | 208.12% |
| 28.02.2005 | -22 256.80 | -8 643.10 | -13 613.70 | 157.51% | - 817.30 | -21 439.50 | 2 623.21% |
| 31.01.2005 | -8 643.10 | -16 949.20 | 8 306.10 | -49.01% | 14 013.40 | -22 656.50 | - 161.68% |
| 31.12.2004 | -16 949.20 | -5 797.60 | -11 151.60 | 192.35% | -33 409.40 | 16 460.20 | -49.27% |
| 30.11.2004 | -5 797.60 | -15 224.90 | 9 427.30 | -61.92% | -4 968.10 | - 829.50 | 16.70% |
| 31.10.2004 | -15 224.90 | -2 021.70 | -13 203.20 | 653.07% | 23 249.10 | -38 474.00 | - 165.49% |
| 30.09.2004 | -2 021.70 | 2 488.40 | -4 510.10 | - 181.24% | -10 624.60 | 8 602.90 | -80.97% |
| 31.08.2004 | 2 488.40 | 3 703.00 | -1 214.60 | -32.80% | 8 899.00 | -6 410.60 | -72.04% |
| 31.07.2004 | 3 703.00 | 52 843.60 | -49 140.60 | -92.99% | -1 917.70 | 5 620.70 | - 293.10% |
| 30.06.2004 | 52 843.60 | -6 099.00 | 58 942.60 | - 966.43% | 38 057.90 | 14 785.70 | 38.85% |
| 31.05.2004 | -6 099.00 | -25 695.30 | 19 596.30 | -76.26% | -34 684.50 | 28 585.50 | -82.42% |
| 30.04.2004 | -25 695.30 | 16 992.10 | -42 687.40 | - 251.22% | -29 658.50 | 3 963.20 | -13.36% |
| 31.03.2004 | 16 992.10 | - 817.30 | 17 809.40 | -2 179.05% | -2 614.70 | 19 606.80 | - 749.87% |
| 29.02.2004 | - 817.30 | 14 013.40 | -14 830.70 | - 105.83% | 2 517.60 | -3 334.90 | - 132.46% |
| 31.01.2004 | 14 013.40 | -33 409.40 | 47 422.80 | - 141.94% | -17 055.20 | 31 068.60 | - 182.16% |
| 31.12.2003 | -33 409.40 | -4 968.10 | -28 441.30 | 572.48% | -18 014.40 | -15 395.00 | 85.46% |
| 30.11.2003 | -4 968.10 | 23 249.10 | -28 217.20 | - 121.37% | -16 934.50 | 11 966.40 | -70.66% |
| 31.10.2003 | 23 249.10 | -10 624.60 | 33 873.70 | - 318.82% | 535.30 | 22 713.80 | 4 243.19% |
| 30.09.2003 | -10 624.60 | 8 899.00 | -19 523.60 | - 219.39% | 15 952.30 | -26 576.90 | - 166.60% |
| 31.08.2003 | 8 899.00 | -1 917.70 | 10 816.70 | - 564.05% | -18 968.60 | 27 867.60 | - 146.91% |
| 31.07.2003 | -1 917.70 | 38 057.90 | -39 975.60 | - 105.04% | -11 215.90 | 9 298.20 | -82.90% |
| 30.06.2003 | 38 057.90 | -34 684.50 | 72 742.40 | - 209.73% | 19 637.70 | 18 420.20 | 93.80% |
| 31.05.2003 | -34 684.50 | -29 658.50 | -5 026.00 | 16.95% | 125 341.70 | - 160 026.20 | - 127.67% |
| 30.04.2003 | -29 658.50 | -2 614.70 | -27 043.80 | 1 034.30% | -14 934.00 | -14 724.50 | 98.60% |
| 31.03.2003 | -2 614.70 | 2 517.60 | -5 132.30 | - 203.86% | 7 255.40 | -9 870.10 | - 136.04% |
| 28.02.2003 | 2 517.60 | -17 055.20 | 19 572.80 | - 114.76% | -7 226.60 | 9 744.20 | - 134.84% |
| 31.01.2003 | -17 055.20 | -18 014.40 | 959.20 | -5.32% | - | - | - |
| 31.12.2002 | -18 014.40 | -16 934.50 | -1 079.90 | 6.38% | - | - | - |
| 30.11.2002 | -16 934.50 | 535.30 | -17 469.80 | -3 263.55% | - | - | - |
| 31.10.2002 | 535.30 | 15 952.30 | -15 417.00 | -96.64% | - | - | - |
| 30.09.2002 | 15 952.30 | -18 968.60 | 34 920.90 | - 184.10% | - | - | - |
| 31.08.2002 | -18 968.60 | -11 215.90 | -7 752.70 | 69.12% | - | - | - |
| 31.07.2002 | -11 215.90 | 19 637.70 | -30 853.60 | - 157.11% | - | - | - |
| 30.06.2002 | 19 637.70 | 125 341.70 | - 105 704.00 | -84.33% | - | - | - |
| 31.05.2002 | 125 341.70 | -14 934.00 | 140 275.70 | - 939.30% | - | - | - |
| 30.04.2002 | -14 934.00 | 7 255.40 | -22 189.40 | - 305.83% | - | - | - |
| 31.03.2002 | 7 255.40 | -7 226.60 | 14 482.00 | - 200.40% | - | - | - |
| 28.02.2002 | -7 226.60 | - | - | - | - | - | - |
Graf jako obrázek

Podobné sestavy
Aplikace Ekonomika ČNB ze sekce makroekonomika zobrazuje časové řady hlavních makroekonomických údajů z ekonomiky ČR. Najdete zde přes 10.000 grafů různých hodnot od úrokových sazeb, přes statistiky státního rozpočtu, statistiky ČNB a data zpracovávaná ČSÚ. Data jsou k dispozici obvykle za posledních více než 20 let, od prosince roku 1992. Zdroj dat: ČNB ARAD

