40 Electricity, gas, steam and hot water supply - ekonomika ČNB
Aktualizace dat 40 Electricity, gas, steam and hot water supply v této aplikaci skončila 30.6.2023. Aktualizovná data časových řad najdete na stránkách nové aplikace z dat ARAD ČNB
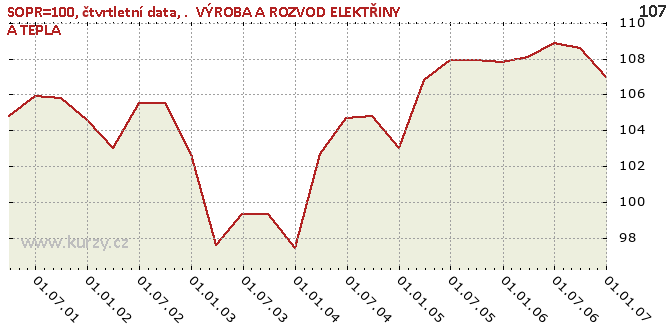
Graf hodnot, y-o-y indices, quarterly data
Meziroční srovnání
Minima a maxima
| Typ | Období | Hodnota |
|---|---|---|
| Max | 30.06.2006 | 108.90 |
| Min | 31.12.2003 | 97.40 |
Historické hodnoty
| Období | Hodnota | Předchozí | Rozdíl | Změna | Před rokem | Rozdíl | Změna |
|---|---|---|---|---|---|---|---|
| 31.12.2006 | 107.00 | 108.60 | -1.60 | -1.47% | 107.80 | -0.80 | -0.74% |
| 30.09.2006 | 108.60 | 108.90 | -0.30 | -0.28% | 107.90 | 0.70 | 0.65% |
| 30.06.2006 | 108.90 | 108.10 | 0.80 | 0.74% | 107.90 | 1.00 | 0.93% |
| 31.03.2006 | 108.10 | 107.80 | 0.30 | 0.28% | 106.80 | 1.30 | 1.22% |
| 31.12.2005 | 107.80 | 107.90 | -0.10 | -0.09% | 103.00 | 4.80 | 4.66% |
| 30.09.2005 | 107.90 | 107.90 | 0.00 | 0.00 | 104.80 | 3.10 | 2.96% |
| 30.06.2005 | 107.90 | 106.80 | 1.10 | 1.03% | 104.70 | 3.20 | 3.06% |
| 31.03.2005 | 106.80 | 103.00 | 3.80 | 3.69% | 102.70 | 4.10 | 3.99% |
| 31.12.2004 | 103.00 | 104.80 | -1.80 | -1.72% | 97.40 | 5.60 | 5.75% |
| 30.09.2004 | 104.80 | 104.70 | 0.10 | 0.10% | 99.30 | 5.50 | 5.54% |
| 30.06.2004 | 104.70 | 102.70 | 2.00 | 1.95% | 99.30 | 5.40 | 5.44% |
| 31.03.2004 | 102.70 | 97.40 | 5.30 | 5.44% | 97.60 | 5.10 | 5.23% |
| 31.12.2003 | 97.40 | 99.30 | -1.90 | -1.91% | 102.70 | -5.30 | -5.16% |
| 30.09.2003 | 99.30 | 99.30 | 0.00 | 0.00 | 105.50 | -6.20 | -5.88% |
| 30.06.2003 | 99.30 | 97.60 | 1.70 | 1.74% | 105.50 | -6.20 | -5.88% |
| 31.03.2003 | 97.60 | 102.70 | -5.10 | -4.97% | 103.00 | -5.40 | -5.24% |
| 31.12.2002 | 102.70 | 105.50 | -2.80 | -2.65% | 104.60 | -1.90 | -1.82% |
| 30.09.2002 | 105.50 | 105.50 | 0.00 | 0.00 | 105.80 | -0.30 | -0.28% |
| 30.06.2002 | 105.50 | 103.00 | 2.50 | 2.43% | 105.90 | -0.40 | -0.38% |
| 31.03.2002 | 103.00 | 104.60 | -1.60 | -1.53% | 104.80 | -1.80 | -1.72% |
| 31.12.2001 | 104.60 | 105.80 | -1.20 | -1.13% | - | - | - |
| 30.09.2001 | 105.80 | 105.90 | -0.10 | -0.09% | - | - | - |
| 30.06.2001 | 105.90 | 104.80 | 1.10 | 1.05% | - | - | - |
| 31.03.2001 | 104.80 | - | - | - | - | - | - |
Graf jako obrázek

Podobné sestavy
Aplikace Ekonomika ČNB ze sekce makroekonomika zobrazuje časové řady hlavních makroekonomických údajů z ekonomiky ČR. Najdete zde přes 10.000 grafů různých hodnot od úrokových sazeb, přes statistiky státního rozpočtu, statistiky ČNB a data zpracovávaná ČSÚ. Data jsou k dispozici obvykle za posledních více než 20 let, od prosince roku 1992. Zdroj dat: ČNB ARAD

