Other liabilities (Equity funds balance sheet) - ekonomika ČNB
Aktualizace dat Other liabilities (Equity funds balance sheet) v této aplikaci skončila 30.6.2023. Aktualizovná data časových řad najdete na stránkách nové aplikace z dat ARAD ČNB
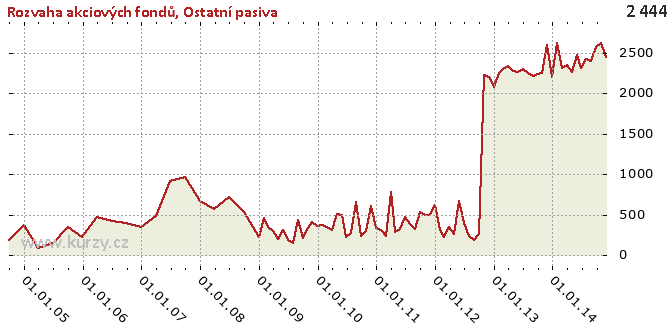
Graf hodnot, Equity funds balance sheet
Meziroční srovnání
Minima a maxima
| Typ | Období | Hodnota |
|---|---|---|
| Max | 31.10.2014 | 2 625.68 |
| Min | 31.03.2005 | 82.85 |
Historické hodnoty
| Období | Hodnota | Předchozí | Rozdíl | Změna | Před rokem | Rozdíl | Změna |
|---|---|---|---|---|---|---|---|
| 30.11.2014 | 2 445.00 | 2 625.68 | - 180.69 | -6.88% | 2 597.65 | - 152.65 | -5.88% |
| 31.10.2014 | 2 625.68 | 2 567.92 | 57.76 | 2.25% | 2 252.11 | 373.57 | 16.59% |
| 30.09.2014 | 2 567.92 | 2 404.34 | 163.58 | 6.80% | 2 233.39 | 334.53 | 14.98% |
| 31.08.2014 | 2 404.34 | 2 425.32 | -20.98 | -0.86% | 2 211.45 | 192.90 | 8.72% |
| 31.07.2014 | 2 425.32 | 2 316.07 | 109.25 | 4.72% | 2 247.70 | 177.62 | 7.90% |
| 30.06.2014 | 2 316.07 | 2 471.73 | - 155.66 | -6.30% | 2 295.68 | 20.39 | 0.89% |
| 31.05.2014 | 2 471.73 | 2 267.90 | 203.83 | 8.99% | 2 263.29 | 208.44 | 9.21% |
| 30.04.2014 | 2 267.90 | 2 342.96 | -75.06 | -3.20% | 2 269.56 | -1.67 | -0.07% |
| 31.03.2014 | 2 342.96 | 2 315.31 | 27.65 | 1.19% | 2 333.90 | 9.06 | 0.39% |
| 28.02.2014 | 2 315.31 | 2 614.75 | - 299.43 | -11.45% | 2 303.81 | 11.50 | 0.50% |
| 31.01.2014 | 2 614.75 | 2 198.62 | 416.13 | 18.93% | 2 245.44 | 369.30 | 16.45% |
| 31.12.2013 | 2 198.62 | 2 597.65 | - 399.03 | -15.36% | 2 076.37 | 122.25 | 5.89% |
| 30.11.2013 | 2 597.65 | 2 252.11 | 345.54 | 15.34% | 2 198.68 | 398.97 | 18.15% |
| 31.10.2013 | 2 252.11 | 2 233.39 | 18.72 | 0.84% | 2 229.02 | 23.10 | 1.04% |
| 30.09.2013 | 2 233.39 | 2 211.45 | 21.95 | 0.99% | 264.41 | 1 968.98 | 744.66% |
| 31.08.2013 | 2 211.45 | 2 247.70 | -36.25 | -1.61% | 187.56 | 2 023.88 | 1 079.03% |
| 31.07.2013 | 2 247.70 | 2 295.68 | -47.98 | -2.09% | 235.25 | 2 012.44 | 855.44% |
| 30.06.2013 | 2 295.68 | 2 263.29 | 32.38 | 1.43% | 391.66 | 1 904.01 | 486.14% |
| 31.05.2013 | 2 263.29 | 2 269.56 | -6.27 | -0.28% | 665.10 | 1 598.19 | 240.29% |
| 30.04.2013 | 2 269.56 | 2 333.90 | -64.34 | -2.76% | 266.23 | 2 003.34 | 752.49% |
| 31.03.2013 | 2 333.90 | 2 303.81 | 30.09 | 1.31% | 343.83 | 1 990.07 | 578.80% |
| 28.02.2013 | 2 303.81 | 2 245.44 | 58.37 | 2.60% | 223.65 | 2 080.16 | 930.10% |
| 31.01.2013 | 2 245.44 | 2 076.37 | 169.07 | 8.14% | 314.29 | 1 931.15 | 614.45% |
| 31.12.2012 | 2 076.37 | 2 198.68 | - 122.31 | -5.56% | 615.91 | 1 460.46 | 237.12% |
| 30.11.2012 | 2 198.68 | 2 229.02 | -30.34 | -1.36% | 491.55 | 1 707.13 | 347.30% |
| 31.10.2012 | 2 229.02 | 264.41 | 1 964.61 | 743.01% | 491.77 | 1 737.25 | 353.27% |
| 30.09.2012 | 264.41 | 187.56 | 76.85 | 40.97% | 530.35 | - 265.93 | -50.14% |
| 31.08.2012 | 187.56 | 235.25 | -47.69 | -20.27% | 317.52 | - 129.96 | -40.93% |
| 31.07.2012 | 235.25 | 391.66 | - 156.41 | -39.93% | 389.82 | - 154.56 | -39.65% |
| 30.06.2012 | 391.66 | 665.10 | - 273.44 | -41.11% | 469.21 | -77.55 | -16.53% |
| 31.05.2012 | 665.10 | 266.23 | 398.88 | 149.83% | 326.97 | 338.13 | 103.41% |
| 30.04.2012 | 266.23 | 343.83 | -77.60 | -22.57% | 281.80 | -15.58 | -5.53% |
| 31.03.2012 | 343.83 | 223.65 | 120.18 | 53.73% | 778.19 | - 434.36 | -55.82% |
| 29.02.2012 | 223.65 | 314.29 | -90.64 | -28.84% | 234.64 | -10.99 | -4.68% |
| 31.01.2012 | 314.29 | 615.91 | - 301.62 | -48.97% | 306.41 | 7.88 | 2.57% |
| 31.12.2011 | 615.91 | 491.55 | 124.36 | 25.30% | 338.18 | 277.73 | 82.13% |
| 30.11.2011 | 491.55 | 491.77 | -0.22 | -0.04% | 605.07 | - 113.52 | -18.76% |
| 31.10.2011 | 491.77 | 530.35 | -38.58 | -7.27% | 301.79 | 189.98 | 62.95% |
| 30.09.2011 | 530.35 | 317.52 | 212.82 | 67.03% | 238.56 | 291.79 | 122.31% |
| 31.08.2011 | 317.52 | 389.82 | -72.30 | -18.55% | 652.70 | - 335.18 | -51.35% |
| 31.07.2011 | 389.82 | 469.21 | -79.39 | -16.92% | 273.10 | 116.72 | 42.74% |
| 30.06.2011 | 469.21 | 326.97 | 142.24 | 43.50% | 220.01 | 249.19 | 113.26% |
| 31.05.2011 | 326.97 | 281.80 | 45.16 | 16.03% | 496.80 | - 169.83 | -34.19% |
| 30.04.2011 | 281.80 | 778.19 | - 496.38 | -63.79% | 509.37 | - 227.57 | -44.68% |
| 31.03.2011 | 778.19 | 234.64 | 543.54 | 231.65% | 305.65 | 472.53 | 154.60% |
| 28.02.2011 | 234.64 | 306.41 | -71.77 | -23.42% | 345.21 | - 110.57 | -32.03% |
| 31.01.2011 | 306.41 | 338.18 | -31.77 | -9.39% | 375.79 | -69.38 | -18.46% |
| 31.12.2010 | 338.18 | 605.07 | - 266.89 | -44.11% | 364.86 | -26.68 | -7.31% |
| 30.11.2010 | 605.07 | 301.79 | 303.27 | 100.49% | 410.26 | 194.81 | 47.48% |
| 31.10.2010 | 301.79 | 238.56 | 63.23 | 26.51% | 330.02 | -28.23 | -8.55% |
| 30.09.2010 | 238.56 | 652.70 | - 414.14 | -63.45% | 207.61 | 30.95 | 14.91% |
| 31.08.2010 | 652.70 | 273.10 | 379.61 | 139.00% | 438.00 | 214.70 | 49.02% |
| 31.07.2010 | 273.10 | 220.01 | 53.08 | 24.13% | 148.14 | 124.96 | 84.35% |
| 30.06.2010 | 220.01 | 496.80 | - 276.79 | -55.71% | 190.11 | 29.90 | 15.73% |
| 31.05.2010 | 496.80 | 509.37 | -12.57 | -2.47% | 315.91 | 180.89 | 57.26% |
| 30.04.2010 | 509.37 | 305.65 | 203.72 | 66.65% | 195.02 | 314.35 | 161.19% |
| 31.03.2010 | 305.65 | 345.21 | -39.56 | -11.46% | 296.60 | 9.06 | 3.05% |
| 28.02.2010 | 345.21 | 375.79 | -30.58 | -8.14% | 342.41 | 2.80 | 0.82% |
| 31.01.2010 | 375.79 | 364.86 | 10.93 | 3.00% | 464.32 | -88.53 | -19.07% |
| 31.12.2009 | 364.86 | 410.26 | -45.40 | -11.07% | 219.97 | 144.89 | 65.87% |
| 30.11.2009 | 410.26 | 330.02 | 80.23 | 24.31% | 527.59 | - 117.33 | -22.24% |
| 31.10.2009 | 330.02 | 207.61 | 122.42 | 58.97% | 527.59 | - 197.56 | -37.45% |
| 30.09.2009 | 207.61 | 438.00 | - 230.39 | -52.60% | 527.59 | - 319.98 | -60.65% |
| 31.08.2009 | 438.00 | 148.14 | 289.86 | 195.67% | 712.67 | - 274.67 | -38.54% |
| 31.07.2009 | 148.14 | 190.11 | -41.98 | -22.08% | 712.67 | - 564.53 | -79.21% |
| 30.06.2009 | 190.11 | 315.91 | - 125.80 | -39.82% | 712.67 | - 522.55 | -73.32% |
| 31.05.2009 | 315.91 | 195.02 | 120.90 | 61.99% | 574.56 | - 258.65 | -45.02% |
| 30.04.2009 | 195.02 | 296.60 | - 101.58 | -34.25% | 574.56 | - 379.54 | -66.06% |
| 31.03.2009 | 296.60 | 342.41 | -45.81 | -13.38% | 574.56 | - 277.96 | -48.38% |
| 28.02.2009 | 342.41 | 464.32 | - 121.91 | -26.26% | 674.49 | - 332.08 | -49.23% |
| 31.01.2009 | 464.32 | 219.97 | 244.35 | 111.08% | 674.49 | - 210.18 | -31.16% |
| 31.12.2008 | 219.97 | 527.59 | - 307.62 | -58.31% | 674.49 | - 454.52 | -67.39% |
| 30.09.2008 | 527.59 | 712.67 | - 185.08 | -25.97% | 968.72 | - 441.13 | -45.54% |
| 30.06.2008 | 712.67 | 574.56 | 138.11 | 24.04% | 916.66 | - 204.00 | -22.25% |
| 31.03.2008 | 574.56 | 674.49 | -99.93 | -14.82% | 482.14 | 92.42 | 19.17% |
| 31.12.2007 | 674.49 | 968.72 | - 294.23 | -30.37% | 347.62 | 326.88 | 94.03% |
| 30.09.2007 | 968.72 | 916.66 | 52.06 | 5.68% | 398.90 | 569.82 | 142.85% |
| 30.06.2007 | 916.66 | 482.14 | 434.52 | 90.12% | 420.07 | 496.59 | 118.22% |
| 31.03.2007 | 482.14 | 347.62 | 134.53 | 38.70% | 474.62 | 7.52 | 1.58% |
| 31.12.2006 | 347.62 | 398.90 | -51.28 | -12.86% | 224.33 | 123.29 | 54.96% |
| 30.09.2006 | 398.90 | 420.07 | -21.17 | -5.04% | 349.68 | 49.22 | 14.08% |
| 30.06.2006 | 420.07 | 474.62 | -54.55 | -11.49% | 149.15 | 270.92 | 181.63% |
| 31.03.2006 | 474.62 | 224.33 | 250.29 | 111.57% | 82.85 | 391.78 | 472.89% |
| 31.12.2005 | 224.33 | 349.68 | - 125.35 | -35.85% | 370.28 | - 145.95 | -39.42% |
| 30.09.2005 | 349.68 | 149.15 | 200.53 | 134.44% | 189.90 | 159.78 | 84.14% |
| 30.06.2005 | 149.15 | 82.85 | 66.31 | 80.04% | - | - | - |
| 31.03.2005 | 82.85 | 370.28 | - 287.43 | -77.63% | - | - | - |
| 31.12.2004 | 370.28 | 189.90 | 180.38 | 94.98% | - | - | - |
| 30.09.2004 | 189.90 | - | - | - | - | - | - |
Graf jako obrázek

Podobné sestavy
Aplikace Ekonomika ČNB ze sekce makroekonomika zobrazuje časové řady hlavních makroekonomických údajů z ekonomiky ČR. Najdete zde přes 10.000 grafů různých hodnot od úrokových sazeb, přes statistiky státního rozpočtu, statistiky ČNB a data zpracovávaná ČSÚ. Data jsou k dispozici obvykle za posledních více než 20 let, od prosince roku 1992. Zdroj dat: ČNB ARAD

