Securities other than shares (Financial assets, stocks, quaterly, Rest of the world) - ekonomika ČNB
Aktualizace dat Securities other than shares (Financial assets, stocks, quaterly, Rest of the world) v této aplikaci skončila 30.6.2023. Aktualizovná data časových řad najdete na stránkách nové aplikace z dat ARAD ČNB
Nové časové řady makroekonomiky a jejich data
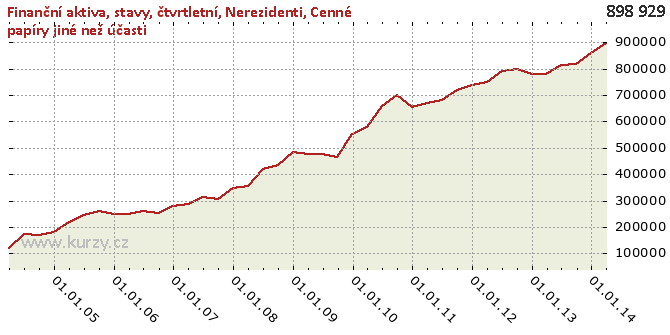
Graf hodnot, Financial assets, stocks, quaterly, Rest of the world
Meziroční srovnání
Minima a maxima
| Typ | Období | Hodnota |
|---|---|---|
| Max | 31.03.2014 | 898 929.00 |
| Min | 31.03.2004 | 118 901.00 |
Historické hodnoty
| Období | Hodnota | Předchozí | Rozdíl | Změna | Před rokem | Rozdíl | Změna |
|---|---|---|---|---|---|---|---|
| 31.03.2014 | 898 929.00 | 857 757.00 | 41 172.00 | 4.80% | 778 753.00 | 120 176.00 | 15.43% |
| 31.12.2013 | 857 757.00 | 818 753.00 | 39 004.00 | 4.76% | 780 728.00 | 77 029.00 | 9.87% |
| 30.09.2013 | 818 753.00 | 813 850.00 | 4 903.00 | 0.60% | 796 996.00 | 21 757.00 | 2.73% |
| 30.06.2013 | 813 850.00 | 778 753.00 | 35 097.00 | 4.51% | 792 904.00 | 20 946.00 | 2.64% |
| 31.03.2013 | 778 753.00 | 780 728.00 | -1 975.00 | -0.25% | 750 339.00 | 28 414.00 | 3.79% |
| 31.12.2012 | 780 728.00 | 796 996.00 | -16 268.00 | -2.04% | 738 642.00 | 42 086.00 | 5.70% |
| 30.09.2012 | 796 996.00 | 792 904.00 | 4 092.00 | 0.52% | 718 194.00 | 78 802.00 | 10.97% |
| 30.06.2012 | 792 904.00 | 750 339.00 | 42 565.00 | 5.67% | 682 174.00 | 110 730.00 | 16.23% |
| 31.03.2012 | 750 339.00 | 738 642.00 | 11 697.00 | 1.58% | 670 758.00 | 79 581.00 | 11.86% |
| 31.12.2011 | 738 642.00 | 718 194.00 | 20 448.00 | 2.85% | 656 027.00 | 82 615.00 | 12.59% |
| 30.09.2011 | 718 194.00 | 682 174.00 | 36 020.00 | 5.28% | 700 114.00 | 18 080.00 | 2.58% |
| 30.06.2011 | 682 174.00 | 670 758.00 | 11 416.00 | 1.70% | 657 919.00 | 24 255.00 | 3.69% |
| 31.03.2011 | 670 758.00 | 656 027.00 | 14 731.00 | 2.25% | 578 645.00 | 92 113.00 | 15.92% |
| 31.12.2010 | 656 027.00 | 700 114.00 | -44 087.00 | -6.30% | 552 368.00 | 103 659.00 | 18.77% |
| 30.09.2010 | 700 114.00 | 657 919.00 | 42 195.00 | 6.41% | 466 402.00 | 233 712.00 | 50.11% |
| 30.06.2010 | 657 919.00 | 578 645.00 | 79 274.00 | 13.70% | 477 605.00 | 180 314.00 | 37.75% |
| 31.03.2010 | 578 645.00 | 552 368.00 | 26 277.00 | 4.76% | 477 039.00 | 101 606.00 | 21.30% |
| 31.12.2009 | 552 368.00 | 466 402.00 | 85 966.00 | 18.43% | 484 864.00 | 67 504.00 | 13.92% |
| 30.09.2009 | 466 402.00 | 477 605.00 | -11 203.00 | -2.35% | 436 775.00 | 29 627.00 | 6.78% |
| 30.06.2009 | 477 605.00 | 477 039.00 | 566.00 | 0.12% | 418 795.00 | 58 810.00 | 14.04% |
| 31.03.2009 | 477 039.00 | 484 864.00 | -7 825.00 | -1.61% | 355 397.00 | 121 642.00 | 34.23% |
| 31.12.2008 | 484 864.00 | 436 775.00 | 48 089.00 | 11.01% | 347 308.00 | 137 556.00 | 39.61% |
| 30.09.2008 | 436 775.00 | 418 795.00 | 17 980.00 | 4.29% | 304 778.00 | 131 997.00 | 43.31% |
| 30.06.2008 | 418 795.00 | 355 397.00 | 63 398.00 | 17.84% | 315 520.00 | 103 275.00 | 32.73% |
| 31.03.2008 | 355 397.00 | 347 308.00 | 8 089.00 | 2.33% | 286 932.00 | 68 465.00 | 23.86% |
| 31.12.2007 | 347 308.00 | 304 778.00 | 42 530.00 | 13.95% | 281 335.00 | 65 973.00 | 23.45% |
| 30.09.2007 | 304 778.00 | 315 520.00 | -10 742.00 | -3.40% | 251 406.00 | 53 372.00 | 21.23% |
| 30.06.2007 | 315 520.00 | 286 932.00 | 28 588.00 | 9.96% | 259 720.00 | 55 800.00 | 21.48% |
| 31.03.2007 | 286 932.00 | 281 335.00 | 5 597.00 | 1.99% | 251 115.00 | 35 817.00 | 14.26% |
| 31.12.2006 | 281 335.00 | 251 406.00 | 29 929.00 | 11.90% | 248 530.00 | 32 805.00 | 13.20% |
| 30.09.2006 | 251 406.00 | 259 720.00 | -8 314.00 | -3.20% | 261 196.00 | -9 790.00 | -3.75% |
| 30.06.2006 | 259 720.00 | 251 115.00 | 8 605.00 | 3.43% | 246 522.00 | 13 198.00 | 5.35% |
| 31.03.2006 | 251 115.00 | 248 530.00 | 2 585.00 | 1.04% | 217 653.00 | 33 462.00 | 15.37% |
| 31.12.2005 | 248 530.00 | 261 196.00 | -12 666.00 | -4.85% | 179 286.00 | 69 244.00 | 38.62% |
| 30.09.2005 | 261 196.00 | 246 522.00 | 14 674.00 | 5.95% | 168 168.00 | 93 028.00 | 55.32% |
| 30.06.2005 | 246 522.00 | 217 653.00 | 28 869.00 | 13.26% | 173 498.00 | 73 024.00 | 42.09% |
| 31.03.2005 | 217 653.00 | 179 286.00 | 38 367.00 | 21.40% | 118 901.00 | 98 752.00 | 83.05% |
| 31.12.2004 | 179 286.00 | 168 168.00 | 11 118.00 | 6.61% | - | - | - |
| 30.09.2004 | 168 168.00 | 173 498.00 | -5 330.00 | -3.07% | - | - | - |
| 30.06.2004 | 173 498.00 | 118 901.00 | 54 597.00 | 45.92% | - | - | - |
| 31.03.2004 | 118 901.00 | - | - | - | - | - | - |
Graf jako obrázek

Podobné sestavy
Aplikace Ekonomika ČNB ze sekce makroekonomika zobrazuje časové řady hlavních makroekonomických údajů z ekonomiky ČR. Najdete zde přes 10.000 grafů různých hodnot od úrokových sazeb, přes statistiky státního rozpočtu, statistiky ČNB a data zpracovávaná ČSÚ. Data jsou k dispozici obvykle za posledních více než 20 let, od prosince roku 1992. Zdroj dat: ČNB ARAD

