Unlisted shares (AF.512) (Financial assets, stocks, Rest of the World) - ekonomika ČNB
Aktualizace dat Unlisted shares (AF.512) (Financial assets, stocks, Rest of the World) v této aplikaci skončila 30.6.2023. Aktualizovná data časových řad najdete na stránkách nové aplikace z dat ARAD ČNB
Nové časové řady makroekonomiky a jejich data
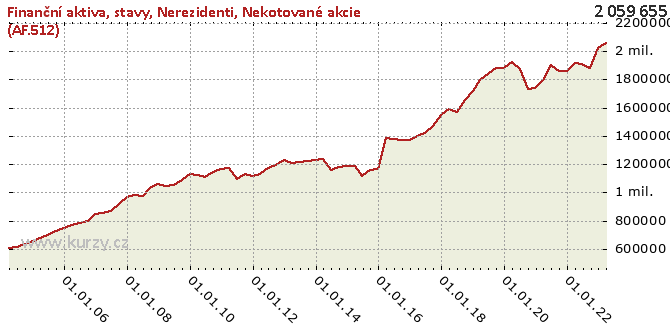
Graf hodnot, Financial assets, stocks, Rest of the World
Meziroční srovnání
Minima a maxima
| Typ | Období | Hodnota |
|---|---|---|
| Max | 31.12.2019 | 1 928 796.00 |
| Min | 31.03.2004 | 602 590.00 |
Historické hodnoty
| Období | Hodnota | Předchozí | Rozdíl | Změna | Před rokem | Rozdíl | Změna |
|---|---|---|---|---|---|---|---|
| 31.03.2020 | 1 926 200.00 | 1 928 796.00 | -2 596.00 | -0.13% | 1 791 276.00 | 134 924.00 | 7.53% |
| 31.12.2019 | 1 928 796.00 | 1 879 080.00 | 49 716.00 | 2.65% | 1 717 451.00 | 211 345.00 | 12.31% |
| 30.09.2019 | 1 879 080.00 | 1 833 764.00 | 45 316.00 | 2.47% | 1 649 933.00 | 229 147.00 | 13.89% |
| 30.06.2019 | 1 833 764.00 | 1 791 276.00 | 42 488.00 | 2.37% | 1 566 089.00 | 267 675.00 | 17.09% |
| 31.03.2019 | 1 791 276.00 | 1 717 451.00 | 73 825.00 | 4.30% | 1 591 032.00 | 200 244.00 | 12.59% |
| 31.12.2018 | 1 717 451.00 | 1 649 933.00 | 67 518.00 | 4.09% | 1 549 601.00 | 167 850.00 | 10.83% |
| 30.09.2018 | 1 649 933.00 | 1 566 089.00 | 83 844.00 | 5.35% | 1 467 932.00 | 182 001.00 | 12.40% |
| 30.06.2018 | 1 566 089.00 | 1 591 032.00 | -24 943.00 | -1.57% | 1 417 317.00 | 148 772.00 | 10.50% |
| 31.03.2018 | 1 591 032.00 | 1 549 601.00 | 41 431.00 | 2.67% | 1 395 691.00 | 195 341.00 | 14.00% |
| 31.12.2017 | 1 549 601.00 | 1 467 932.00 | 81 669.00 | 5.56% | 1 372 609.00 | 176 992.00 | 12.89% |
| 30.09.2017 | 1 467 932.00 | 1 417 317.00 | 50 615.00 | 3.57% | 1 368 779.00 | 99 153.00 | 7.24% |
| 30.06.2017 | 1 417 317.00 | 1 395 691.00 | 21 626.00 | 1.55% | 1 380 464.00 | 36 853.00 | 2.67% |
| 31.03.2017 | 1 395 691.00 | 1 372 609.00 | 23 082.00 | 1.68% | 1 384 117.00 | 11 574.00 | 0.84% |
| 31.12.2016 | 1 372 609.00 | 1 368 779.00 | 3 830.00 | 0.28% | 1 162 511.00 | 210 098.00 | 18.07% |
| 30.09.2016 | 1 368 779.00 | 1 380 464.00 | -11 685.00 | -0.85% | 1 157 623.00 | 211 156.00 | 18.24% |
| 30.06.2016 | 1 380 464.00 | 1 384 117.00 | -3 653.00 | -0.26% | 1 116 340.00 | 264 124.00 | 23.66% |
| 31.03.2016 | 1 384 117.00 | 1 162 511.00 | 221 606.00 | 19.06% | 1 182 929.00 | 201 188.00 | 17.01% |
| 31.12.2015 | 1 162 511.00 | 1 157 623.00 | 4 888.00 | 0.42% | 1 184 820.00 | -22 309.00 | -1.88% |
| 30.09.2015 | 1 157 623.00 | 1 116 340.00 | 41 283.00 | 3.70% | 1 176 119.00 | -18 496.00 | -1.57% |
| 30.06.2015 | 1 116 340.00 | 1 182 929.00 | -66 589.00 | -5.63% | 1 155 042.00 | -38 702.00 | -3.35% |
| 31.03.2015 | 1 182 929.00 | 1 184 820.00 | -1 891.00 | -0.16% | 1 237 623.00 | -54 694.00 | -4.42% |
| 31.12.2014 | 1 184 820.00 | 1 176 119.00 | 8 701.00 | 0.74% | 1 229 706.00 | -44 886.00 | -3.65% |
| 30.09.2014 | 1 176 119.00 | 1 155 042.00 | 21 077.00 | 1.82% | 1 222 478.00 | -46 359.00 | -3.79% |
| 30.06.2014 | 1 155 042.00 | 1 237 623.00 | -82 581.00 | -6.67% | 1 210 799.00 | -55 757.00 | -4.60% |
| 31.03.2014 | 1 237 623.00 | 1 229 706.00 | 7 917.00 | 0.64% | 1 204 920.00 | 32 703.00 | 2.71% |
| 31.12.2013 | 1 229 706.00 | 1 222 478.00 | 7 228.00 | 0.59% | 1 231 129.00 | -1 423.00 | -0.12% |
| 30.09.2013 | 1 222 478.00 | 1 210 799.00 | 11 679.00 | 0.96% | 1 193 929.00 | 28 549.00 | 2.39% |
| 30.06.2013 | 1 210 799.00 | 1 204 920.00 | 5 879.00 | 0.49% | 1 173 399.00 | 37 400.00 | 3.19% |
| 31.03.2013 | 1 204 920.00 | 1 231 129.00 | -26 209.00 | -2.13% | 1 126 728.00 | 78 192.00 | 6.94% |
| 31.12.2012 | 1 231 129.00 | 1 193 929.00 | 37 200.00 | 3.12% | 1 117 861.00 | 113 268.00 | 10.13% |
| 30.09.2012 | 1 193 929.00 | 1 173 399.00 | 20 530.00 | 1.75% | 1 129 889.00 | 64 040.00 | 5.67% |
| 30.06.2012 | 1 173 399.00 | 1 126 728.00 | 46 671.00 | 4.14% | 1 093 941.00 | 79 458.00 | 7.26% |
| 31.03.2012 | 1 126 728.00 | 1 117 861.00 | 8 867.00 | 0.79% | 1 171 073.00 | -44 345.00 | -3.79% |
| 31.12.2011 | 1 117 861.00 | 1 129 889.00 | -12 028.00 | -1.06% | 1 162 080.00 | -44 219.00 | -3.81% |
| 30.09.2011 | 1 129 889.00 | 1 093 941.00 | 35 948.00 | 3.29% | 1 141 460.00 | -11 571.00 | -1.01% |
| 30.06.2011 | 1 093 941.00 | 1 171 073.00 | -77 132.00 | -6.59% | 1 108 428.00 | -14 487.00 | -1.31% |
| 31.03.2011 | 1 171 073.00 | 1 162 080.00 | 8 993.00 | 0.77% | 1 123 201.00 | 47 872.00 | 4.26% |
| 31.12.2010 | 1 162 080.00 | 1 141 460.00 | 20 620.00 | 1.81% | 1 131 160.00 | 30 920.00 | 2.73% |
| 30.09.2010 | 1 141 460.00 | 1 108 428.00 | 33 032.00 | 2.98% | 1 086 432.00 | 55 028.00 | 5.07% |
| 30.06.2010 | 1 108 428.00 | 1 123 201.00 | -14 773.00 | -1.32% | 1 054 892.00 | 53 536.00 | 5.08% |
| 31.03.2010 | 1 123 201.00 | 1 131 160.00 | -7 959.00 | -0.70% | 1 045 816.00 | 77 385.00 | 7.40% |
| 31.12.2009 | 1 131 160.00 | 1 086 432.00 | 44 728.00 | 4.12% | 1 055 710.00 | 75 450.00 | 7.15% |
| 30.09.2009 | 1 086 432.00 | 1 054 892.00 | 31 540.00 | 2.99% | 1 028 060.00 | 58 372.00 | 5.68% |
| 30.06.2009 | 1 054 892.00 | 1 045 816.00 | 9 076.00 | 0.87% | 970 251.00 | 84 641.00 | 8.72% |
| 31.03.2009 | 1 045 816.00 | 1 055 710.00 | -9 894.00 | -0.94% | 977 814.00 | 68 002.00 | 6.95% |
| 31.12.2008 | 1 055 710.00 | 1 028 060.00 | 27 650.00 | 2.69% | 965 526.00 | 90 184.00 | 9.34% |
| 30.09.2008 | 1 028 060.00 | 970 251.00 | 57 809.00 | 5.96% | 919 705.00 | 108 355.00 | 11.78% |
| 30.06.2008 | 970 251.00 | 977 814.00 | -7 563.00 | -0.77% | 870 531.00 | 99 720.00 | 11.46% |
| 31.03.2008 | 977 814.00 | 965 526.00 | 12 288.00 | 1.27% | 851 217.00 | 126 597.00 | 14.87% |
| 31.12.2007 | 965 526.00 | 919 705.00 | 45 821.00 | 4.98% | 847 087.00 | 118 439.00 | 13.98% |
| 30.09.2007 | 919 705.00 | 870 531.00 | 49 174.00 | 5.65% | 795 186.00 | 124 519.00 | 15.66% |
| 30.06.2007 | 870 531.00 | 851 217.00 | 19 314.00 | 2.27% | 780 361.00 | 90 170.00 | 11.55% |
| 31.03.2007 | 851 217.00 | 847 087.00 | 4 130.00 | 0.49% | 769 025.00 | 82 192.00 | 10.69% |
| 31.12.2006 | 847 087.00 | 795 186.00 | 51 901.00 | 6.53% | 749 982.00 | 97 105.00 | 12.95% |
| 30.09.2006 | 795 186.00 | 780 361.00 | 14 825.00 | 1.90% | 727 509.00 | 67 677.00 | 9.30% |
| 30.06.2006 | 780 361.00 | 769 025.00 | 11 336.00 | 1.47% | 697 835.00 | 82 526.00 | 11.83% |
| 31.03.2006 | 769 025.00 | 749 982.00 | 19 043.00 | 2.54% | 677 183.00 | 91 842.00 | 13.56% |
| 31.12.2005 | 749 982.00 | 727 509.00 | 22 473.00 | 3.09% | 655 091.00 | 94 891.00 | 14.49% |
| 30.09.2005 | 727 509.00 | 697 835.00 | 29 674.00 | 4.25% | 635 451.00 | 92 058.00 | 14.49% |
| 30.06.2005 | 697 835.00 | 677 183.00 | 20 652.00 | 3.05% | 609 271.00 | 88 564.00 | 14.54% |
| 31.03.2005 | 677 183.00 | 655 091.00 | 22 092.00 | 3.37% | 602 590.00 | 74 593.00 | 12.38% |
| 31.12.2004 | 655 091.00 | 635 451.00 | 19 640.00 | 3.09% | - | - | - |
| 30.09.2004 | 635 451.00 | 609 271.00 | 26 180.00 | 4.30% | - | - | - |
| 30.06.2004 | 609 271.00 | 602 590.00 | 6 681.00 | 1.11% | - | - | - |
| 31.03.2004 | 602 590.00 | - | - | - | - | - | - |
Graf jako obrázek

Podobné sestavy
Aplikace Ekonomika ČNB ze sekce makroekonomika zobrazuje časové řady hlavních makroekonomických údajů z ekonomiky ČR. Najdete zde přes 10.000 grafů různých hodnot od úrokových sazeb, přes statistiky státního rozpočtu, statistiky ČNB a data zpracovávaná ČSÚ. Data jsou k dispozici obvykle za posledních více než 20 let, od prosince roku 1992. Zdroj dat: ČNB ARAD

