Securities other than shares, excluding FD - ekonomika ČNB
Aktualizace dat Securities other than shares, excluding FD v této aplikaci skončila 30.6.2023. Aktualizovná data časových řad najdete na stránkách nové aplikace z dat ARAD ČNB
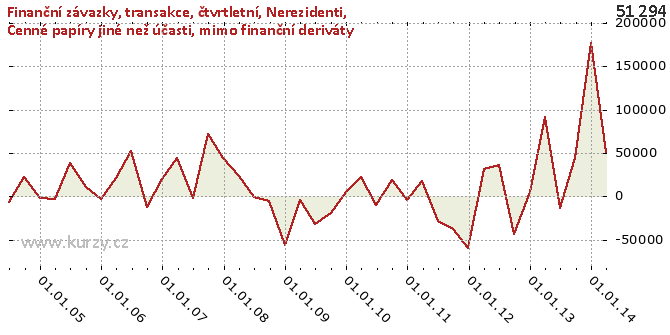
Graf hodnot, Financial liabilities, transactions, quaterly, Rest of the world
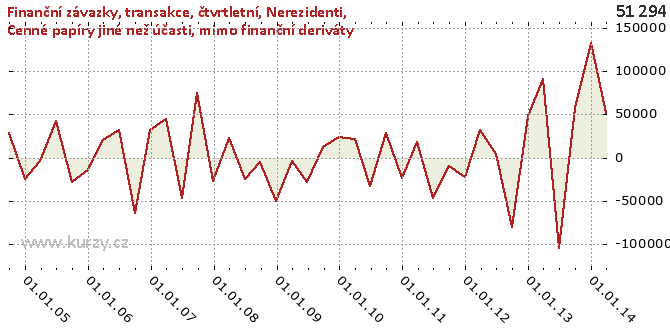
Přepočtený graf hodnot
Časová řada Securities other than shares, excluding FD obsahuje kumulované roční údaje. Následující graf hodnot zobrazuje přepočtená rozdílová data.
Meziroční srovnání
Minima a maxima
| Typ | Období | Hodnota |
|---|---|---|
| Max | 31.12.2013 | 177 425.00 |
| Min | 31.12.2011 | -60 121.00 |
Historické hodnoty
| Období | Hodnota | Předchozí | Rozdíl | Změna | Před rokem | Rozdíl | Změna |
|---|---|---|---|---|---|---|---|
| 31.03.2014 | 51 294.00 | 177 425.00 | - 126 131.00 | -71.09% | 91 346.00 | -40 052.00 | -43.85% |
| 31.12.2013 | 177 425.00 | 44 274.00 | 133 151.00 | 300.74% | 5 444.00 | 171 981.00 | 3 159.09% |
| 30.09.2013 | 44 274.00 | -13 495.00 | 57 769.00 | - 428.08% | -43 095.00 | 87 369.00 | - 202.74% |
| 30.06.2013 | -13 495.00 | 91 346.00 | - 104 841.00 | - 114.77% | 36 525.00 | -50 020.00 | - 136.95% |
| 31.03.2013 | 91 346.00 | 5 444.00 | 85 902.00 | 1 577.92% | 31 890.00 | 59 456.00 | 186.44% |
| 31.12.2012 | 5 444.00 | -43 095.00 | 48 539.00 | - 112.63% | -60 121.00 | 65 565.00 | - 109.06% |
| 30.09.2012 | -43 095.00 | 36 525.00 | -79 620.00 | - 217.99% | -38 031.00 | -5 064.00 | 13.32% |
| 30.06.2012 | 36 525.00 | 31 890.00 | 4 635.00 | 14.53% | -28 638.00 | 65 163.00 | - 227.54% |
| 31.03.2012 | 31 890.00 | -60 121.00 | 92 011.00 | - 153.04% | 18 086.00 | 13 804.00 | 76.32% |
| 31.12.2011 | -60 121.00 | -38 031.00 | -22 090.00 | 58.08% | -4 467.00 | -55 654.00 | 1 245.89% |
| 30.09.2011 | -38 031.00 | -28 638.00 | -9 393.00 | 32.80% | 18 460.00 | -56 491.00 | - 306.02% |
| 30.06.2011 | -28 638.00 | 18 086.00 | -46 724.00 | - 258.34% | -10 360.00 | -18 278.00 | 176.43% |
| 31.03.2011 | 18 086.00 | -4 467.00 | 22 553.00 | - 504.88% | 21 872.00 | -3 786.00 | -17.31% |
| 31.12.2010 | -4 467.00 | 18 460.00 | -22 927.00 | - 124.20% | 4 682.00 | -9 149.00 | - 195.41% |
| 30.09.2010 | 18 460.00 | -10 360.00 | 28 820.00 | - 278.19% | -19 070.00 | 37 530.00 | - 196.80% |
| 30.06.2010 | -10 360.00 | 21 872.00 | -32 232.00 | - 147.37% | -31 959.00 | 21 599.00 | -67.58% |
| 31.03.2010 | 21 872.00 | 4 682.00 | 17 190.00 | 367.15% | -4 305.00 | 26 177.00 | - 608.06% |
| 31.12.2009 | 4 682.00 | -19 070.00 | 23 752.00 | - 124.55% | -55 667.00 | 60 349.00 | - 108.41% |
| 30.09.2009 | -19 070.00 | -31 959.00 | 12 889.00 | -40.33% | -5 816.00 | -13 254.00 | 227.89% |
| 30.06.2009 | -31 959.00 | -4 305.00 | -27 654.00 | 642.37% | - 665.00 | -31 294.00 | 4 705.86% |
| 31.03.2009 | -4 305.00 | -55 667.00 | 51 362.00 | -92.27% | 23 390.00 | -27 695.00 | - 118.41% |
| 31.12.2008 | -55 667.00 | -5 816.00 | -49 851.00 | 857.14% | 44 755.00 | - 100 422.00 | - 224.38% |
| 30.09.2008 | -5 816.00 | - 665.00 | -5 151.00 | 774.59% | 72 146.00 | -77 962.00 | - 108.06% |
| 30.06.2008 | - 665.00 | 23 390.00 | -24 055.00 | - 102.84% | -2 335.00 | 1 670.00 | -71.52% |
| 31.03.2008 | 23 390.00 | 44 755.00 | -21 365.00 | -47.74% | 44 556.00 | -21 166.00 | -47.50% |
| 31.12.2007 | 44 755.00 | 72 146.00 | -27 391.00 | -37.97% | 20 314.00 | 24 441.00 | 120.32% |
| 30.09.2007 | 72 146.00 | -2 335.00 | 74 481.00 | -3 189.76% | -11 957.00 | 84 103.00 | - 703.38% |
| 30.06.2007 | -2 335.00 | 44 556.00 | -46 891.00 | - 105.24% | 52 283.00 | -54 618.00 | - 104.47% |
| 31.03.2007 | 44 556.00 | 20 314.00 | 24 242.00 | 119.34% | 20 665.00 | 23 891.00 | 115.61% |
| 31.12.2006 | 20 314.00 | -11 957.00 | 32 271.00 | - 269.89% | -2 865.00 | 23 179.00 | - 809.04% |
| 30.09.2006 | -11 957.00 | 52 283.00 | -64 240.00 | - 122.87% | 10 828.00 | -22 785.00 | - 210.43% |
| 30.06.2006 | 52 283.00 | 20 665.00 | 31 618.00 | 153.00% | 38 630.00 | 13 653.00 | 35.34% |
| 31.03.2006 | 20 665.00 | -2 865.00 | 23 530.00 | - 821.29% | -3 609.00 | 24 274.00 | - 672.60% |
| 31.12.2005 | -2 865.00 | 10 828.00 | -13 693.00 | - 126.46% | -2 426.00 | - 439.00 | 18.10% |
| 30.09.2005 | 10 828.00 | 38 630.00 | -27 802.00 | -71.97% | 22 337.00 | -11 509.00 | -51.52% |
| 30.06.2005 | 38 630.00 | -3 609.00 | 42 239.00 | -1 170.38% | -6 051.00 | 44 681.00 | - 738.41% |
| 31.03.2005 | -3 609.00 | -2 426.00 | -1 183.00 | 48.76% | - | - | - |
| 31.12.2004 | -2 426.00 | 22 337.00 | -24 763.00 | - 110.86% | - | - | - |
| 30.09.2004 | 22 337.00 | -6 051.00 | 28 388.00 | - 469.15% | - | - | - |
| 30.06.2004 | -6 051.00 | - | - | - | - | - | - |
Graf jako obrázek


Podobné sestavy
Aplikace Ekonomika ČNB ze sekce makroekonomika zobrazuje časové řady hlavních makroekonomických údajů z ekonomiky ČR. Najdete zde přes 10.000 grafů různých hodnot od úrokových sazeb, přes statistiky státního rozpočtu, statistiky ČNB a data zpracovávaná ČSÚ. Data jsou k dispozici obvykle za posledních více než 20 let, od prosince roku 1992. Zdroj dat: ČNB ARAD

